Performance Analysis of 2 Billion Objects in a Single Bucket

Intro 
Object storage deployments keep growing and bucket sizes are now routinely exceeding what were once considered generous limits. While AI, modern analytics, and data lake workloads are pushing bucket sizes to an all-time high, the effects on metadata performance and object list latency are becoming concerns.
This blog explores the performance impact of configuration options, garbage collection, and lifecycle policy management on the common PUT, LIST, GET, and DELETE operations. The data talked about here was taken from synthetic workloads on Ceph Object Gateway (RGW) to better understand the effect large buckets have on performance, and to learn how complex metadata is handled in Ceph so we can create practical guidelines on how to handle buckets of this size. The I/O driver used to generate workloads was elbencho unless otherwise specified.
Earlier posts, Scaling Ceph RGW: A Billion Objects per Bucket and Scaling Ceph to a billion objects and beyond, tested Ceph at the billion-object scale. This study puts 2 billion objects in a single bucket and looks more closely at garbage collection and lifecycle processing.
Test Environment 
4 servers were used for the Ceph storage cluster:
| Component | Specification |
|---|---|
| Processor | 2 x 32-core server CPUs (64 cores and 128 threads in each server) |
| Memory | 512 GB RAM |
| Ceph upstream release | 20.2.1 (Tentacle) |
| Operating system | Enterprise Linux, release 10.2 |
| OS drives | 2 x 480 GB RAID-1 SSD |
| OSD drives | 16 x 15.36 TB read-intensive enterprise PCIe Gen 4 TLC NVMe SSDs |
| Network interfaces | Data: dual-port 100 GbE adapter Management: 2x 1 GbE |
4 physical clients were used to drive the workload:
| Component | Specification |
|---|---|
| Processor | Server CPU @ 2.40 GHz |
| Memory | 256 GB RAM |
| Operating system | Enterprise Linux, release 10.1 |
| Network | 2x 100 GbE links (on one dual-port 100 GbE adapter) |
The terms "Low Load", "Medium Load", and "High Load" used throughout this article are nominal client load levels for a steady-state workload of 70% GET and 30% PUT. The maximum rate measured for this configuration was about 11600 objects/sec. The achieved rates varied from run to run with warmup, fill and caching, so the table below shows the share of that maximum actually reached.
| Client I/O Load | Low | Medium | High |
|---|---|---|---|
| Achieved share of 11,600 objects/sec | 7-9% | 19-23% | 31-42% |
Additional environment details provided at the end of the article.
Creating the Objects 
Test Description: We created a single bucket and pre-sharded it to num-shards=20011. This value was used to stay below the default rgw_max_objs_per_shard value of 100000 in order to avoid resharding during the exercise when creating 2 billion objects. The value of rgw_max_dynamic_shards was also raised to 20011, which is above the default limit of 1999. Then we populated the bucket to 2 billion 64 KiB objects using a realistic lakehouse prefix layout (e.g. warehouse/db/table/metadata/... and warehouse/db/table/data/partition/...). Dynamic resharding adds shards only to a bucket that has fewer than rgw_max_dynamic_shards shards, so the bucket stayed at 20011 shards even after the garbage collection tests below added 10 million more objects and took it past 100000 objects per shard. 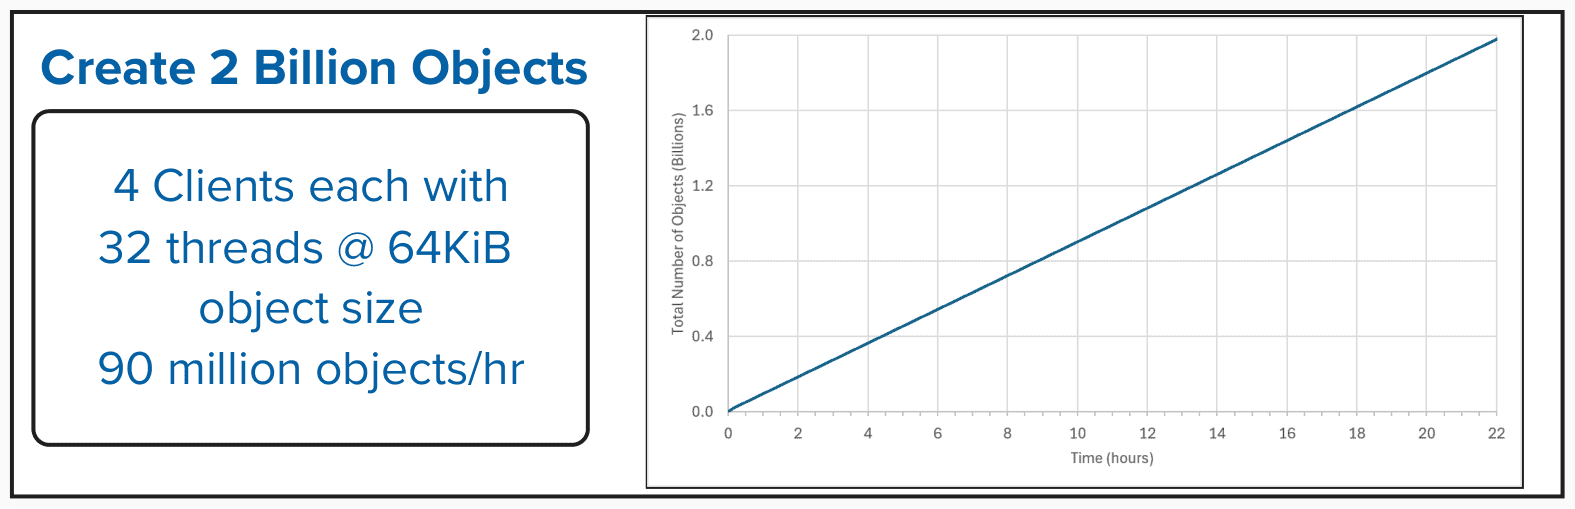
Listing the Objects 
The term "Latency" used here is the amount of time it takes for the issued operation to complete.
Test Description: We ran a single CLI command with aws s3api, boto3, elbencho, or s5cmd to return the first page of 1000 S3 objects. 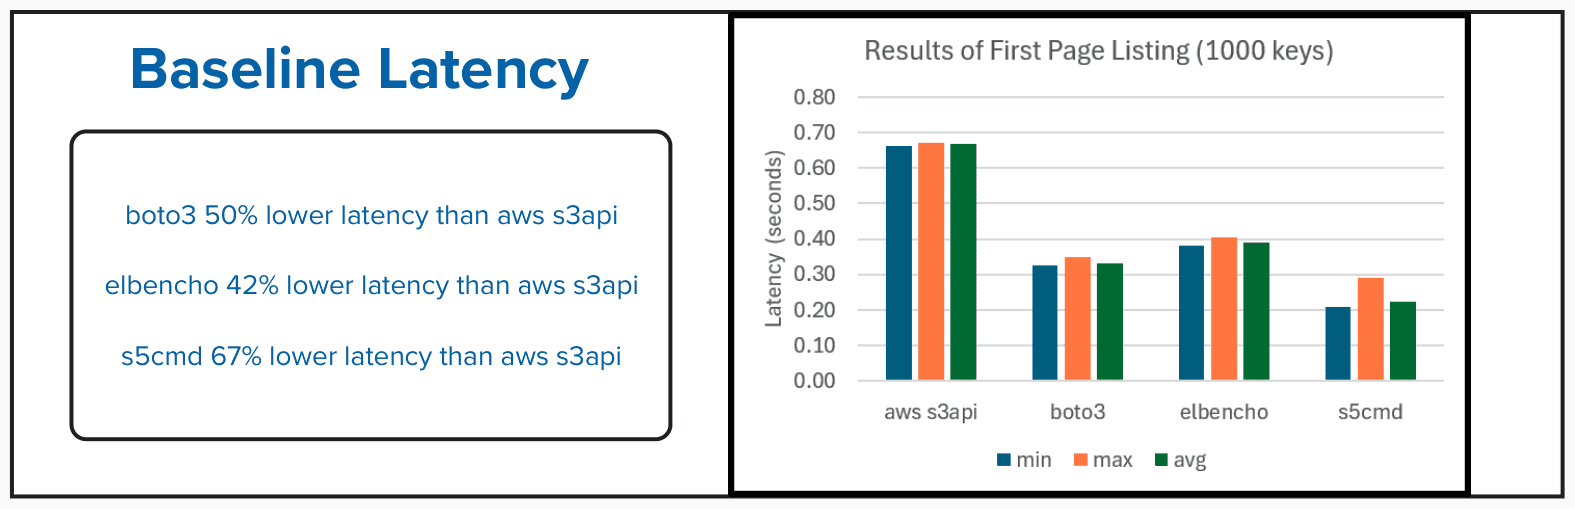 Based on the baseline latency results for the four clients used for listing objects combined with the overall demands of workload patterns for the testing in this document, we decided to go with
elbencho as our primary testing driver.
Test Description: We ran a single elbencho command to return the first page of X objects, where the value of X is between 1000 and 100000 objects. 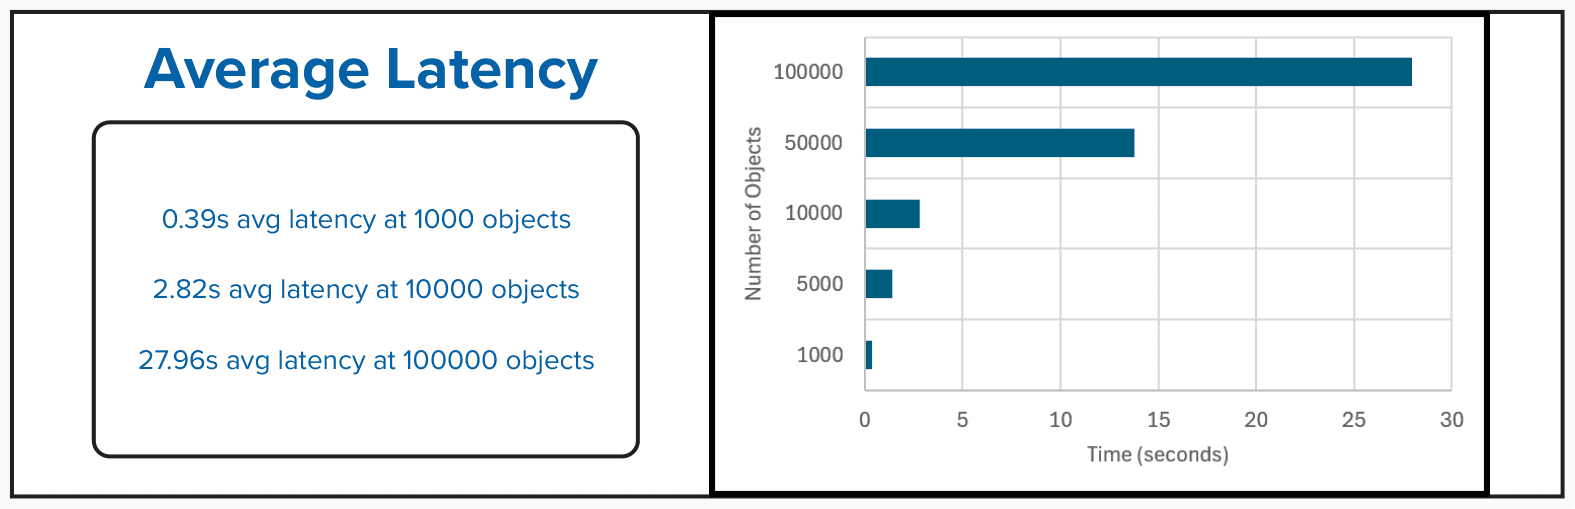
Resharding Disruption Window at 2 Billion Objects 
Test Description: Using elbencho, we started up a steady-state mixed workload of 70% GET and 30% PUT at the 64 KiB object size, at about 48% of the maximum rate. This test ran earlier than the others, at a higher load than the High level in the later tests. We let the workload run for ~20 minutes, then we issued the radosgw-admin command to manually reshard the bucket to num_shards=25013 to observe the impact resharding has on client I/O. 25013 shards was selected to target an objects per shard ratio of 80%. 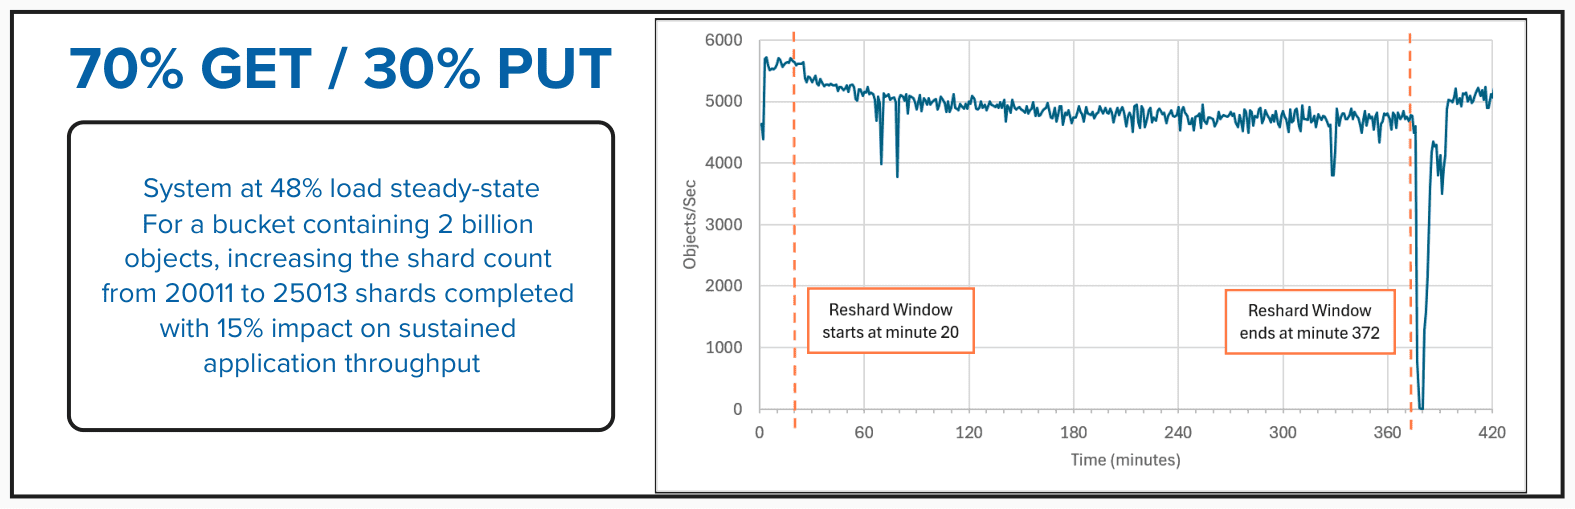 We manually resharded the bucket from 20011 to 25013, which with 2 billion objects required an elapsed 5 hours and 51 minutes. During the reshard, throughput dropped from about 5600 to about 4800 objects/sec, roughly 15%. At the end of the reshard it fell to zero for several minutes. Because each
elbencho thread issues its requests in turn, a blocked PUT also holds up that thread's GET requests. Beginning with the Tentacle release, client writes are accepted during resharding: new objects accumulate as "delta keys". When resharding completes, bucket writes are blocked while these delta keys are integrated. This block and the concomitant drop in performance is expected behavior. Earlier Ceph releases blocked for the entire reshard process; this recent optimization significantly improves the client experience during dynamic or manual resharding. For workloads where the number of RGW objects per bucket is reasonably constant, pre-sharding the bucket may still be beneficial. For workloads where the number of objects per bucket varies considerably over time, dynamic resharding can enable faster LIST operations when the object count is lower.
For the remainder of testing below, the bucket was recreated and populated with the num_shards=20011 setting.
Delete Performance at 2 Billion Objects 
Multi-Delete versus Structured-Delete 
During our delete testing, we were presented with two methods of handling deletes using elbencho:
• Multi-Delete uses the --s3multidel parameter, which sends S3 multi-object delete requests of 1 to 1000 objects each. Prior knowledge of the directory structure is not required. The application issues a listing of the targeted prefix contents and then processes the deletions based on the listing. It is important to note that --s3multidel is a single-threaded operation with elbencho.
• Structured-Delete does not use the --s3multidel parameter and thus requires prior knowledge of the directory structure within the given prefix to correctly delete the objects.
Test Description: We deleted 10 partitions of 39600 objects each with a single RGW.
| Metric | Multi-Delete | Structured-Delete |
|---|---|---|
| Total partitions deleted | 10 | 10 |
| Total objects deleted | 396000 | 396000 |
Objects per DELETE request | 1000 | 1 |
| Number of RGW endpoints | 1 | 1 |
Number of elbencho threads | 1 | 132 |
| Average objects/sec | 2228 | 24321 |
| Average request latency (ms) | 444.50 | 5.25 |
These results compare 1 elbencho thread with 132, so they show the limit of elbencho's single-threaded --s3multidel mode, not of S3 multi-object delete itself. The latencies aren't directly comparable either: a Multi-Delete request removes up to 1000 objects, while a Structured-Delete request removes one. Multi-Delete also produces high client latency since the application needs to list the objects before it can delete them. Listing large buckets is always a slow and paginated operation. Some clients or libraries issue a LIST before every command, which is to be avoided. For the remainder of our testing, we chose to invoke Structured-Delete.
Test Description: Using elbencho, we started up a steady-state mixed workload of 70% GET and 30% PUT at the 64 KiB object size. We let the workload run for 10 minutes, then we issued the elbencho command to Structured-Delete 19.8 million objects. 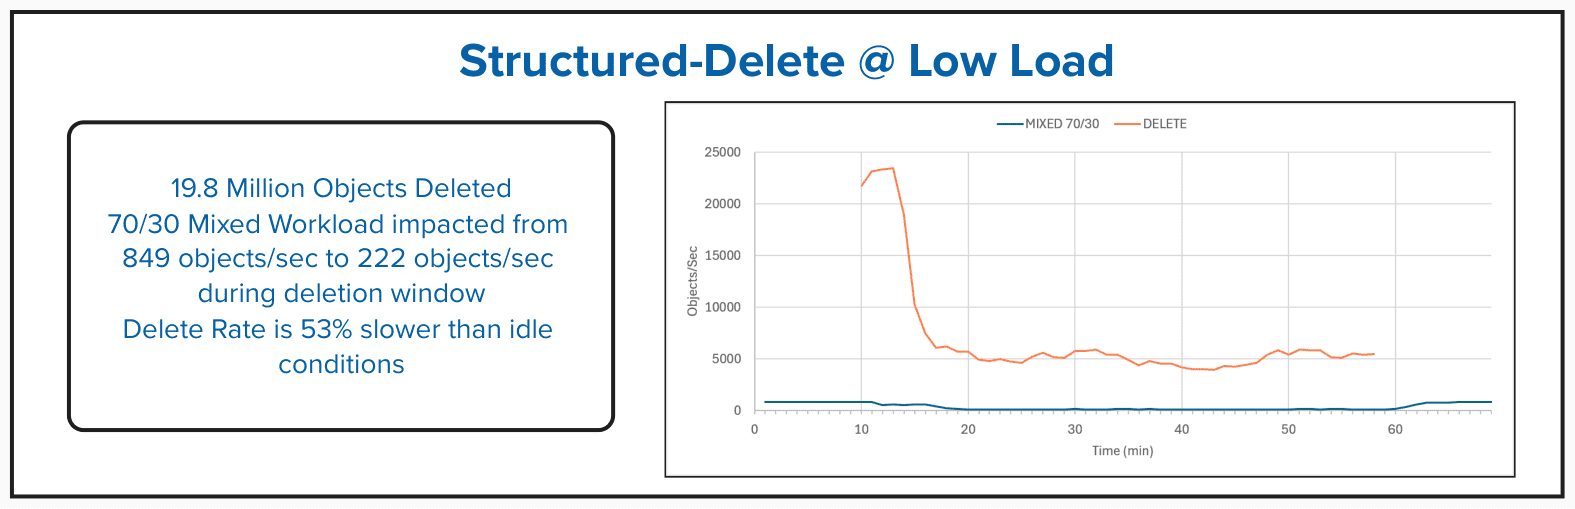
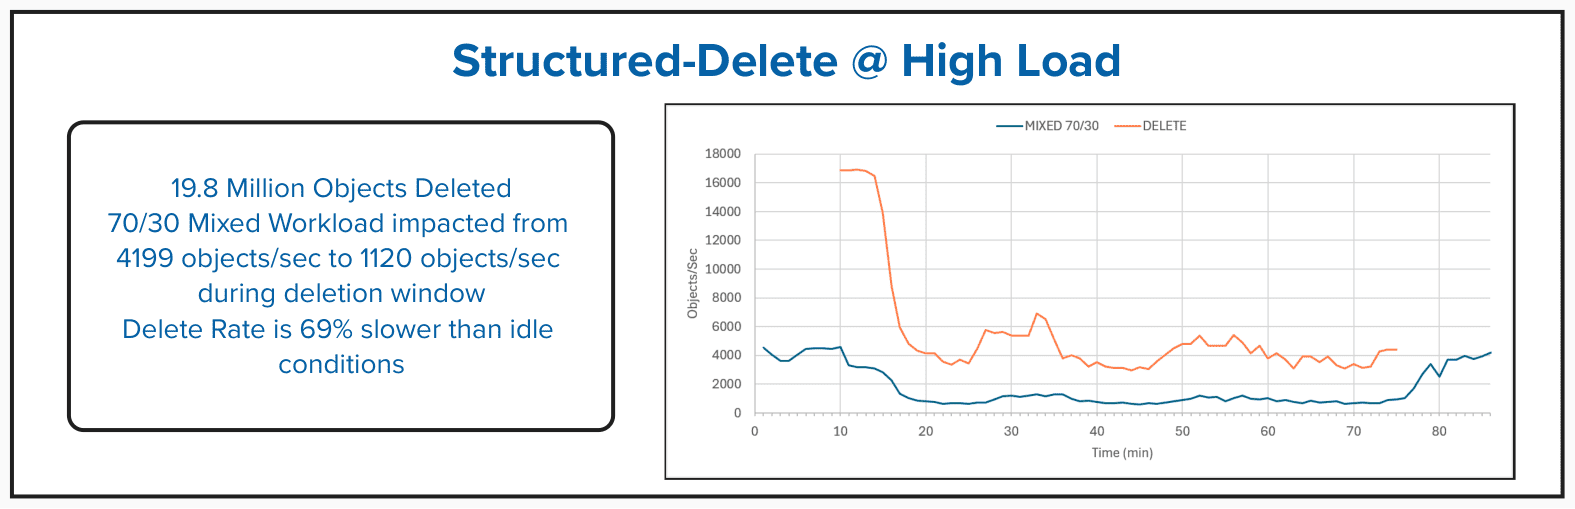 Structured-delete is faster to delete many objects because it is not only multi-threaded, but it also does not require the application to list objects before deleting them. Adding client I/O will elongate the duration of the deletion window and there will be a high impact on client I/O since system resources are more committed to the delete operation.
Garbage Collection at 2 Billion Objects 
RGW stores up to rgw_max_chunk_size (4 MiB by default) of an object's data in its head object and the rest in tail objects. Deleting an object removes the head right away and sends only the tail objects to garbage collection (GC), so deleting 64 KiB objects never involves GC. To exercise GC, we created a mixed object-size profile of 2 billion small objects (64 KiB, in metadata/ and data/) and 10 million large objects (16 MiB, in data/).
Test Description: Using the structured-delete method with elbencho, we removed 2 million 16 MiB objects. 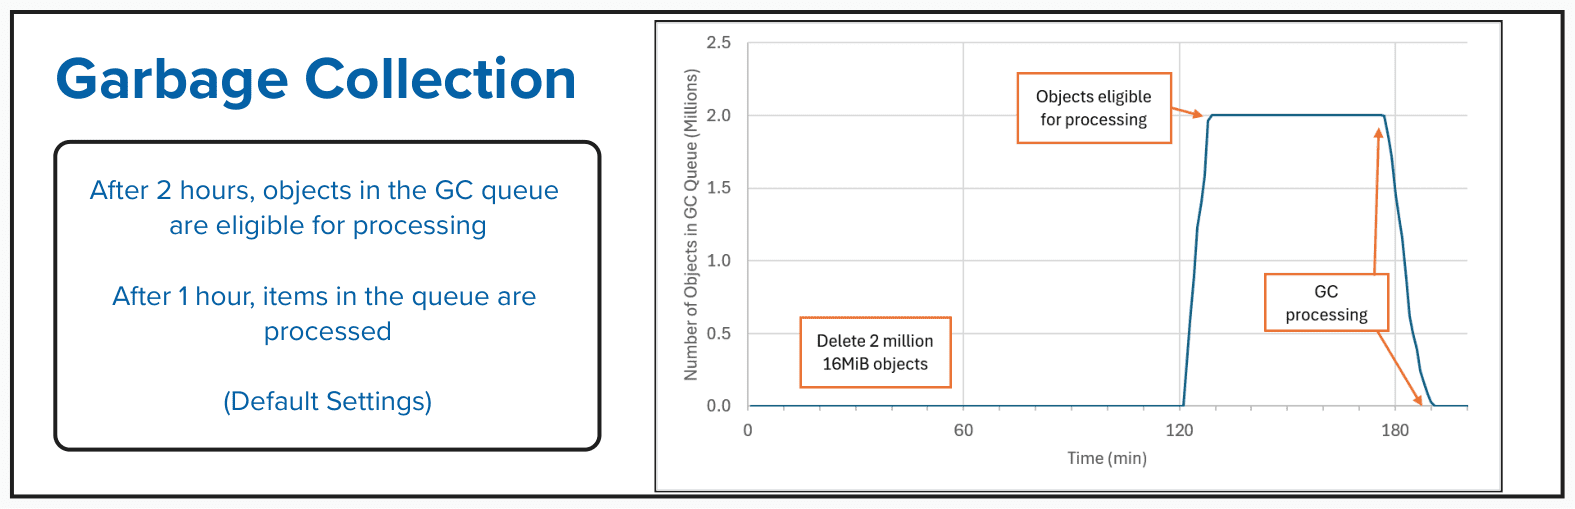 The deleted objects entered the GC queue as soon as they were deleted, but each entry becomes eligible for processing only after
rgw_gc_obj_min_wait (7200 seconds, or 2 hours, by default). The chart counts eligible entries, which is also what radosgw-admin gc list shows unless you add --include-all, so the queue appears to fill 2 hours after the deletion. GC runs every rgw_gc_processor_period (3600 seconds by default), so eligible entries can wait up to another hour; here processing began about an hour after they became eligible. The average drain rate of the GC queue was 2161 objects/sec, which took 15 minutes and 25 seconds to be fully emptied. 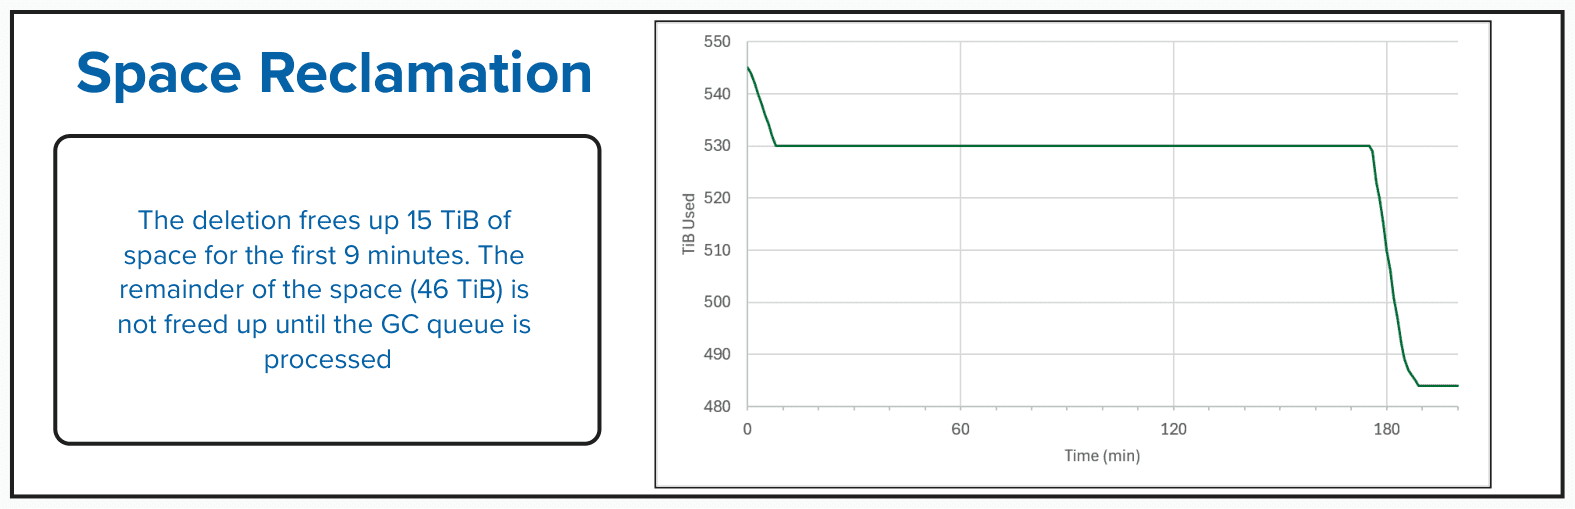
GC Drain Rate Under Load 
Test Description: Using elbencho, we started up a steady-state mixed workload of 70% GET and 30% PUT at the 64 KiB object size. We let the workload run for 10 minutes, then we issued the elbencho command to structured-delete 2 million 16 MiB objects. We let the GC queue fill, then 10 minutes later we drained it manually with radosgw-admin gc process.
For this test, the following variables were adjusted to focus on drain rate performance:
ceph config set client.rgw rgw_gc_obj_min_wait 1800
ceph config set client.rgw rgw_enable_gc_threads false
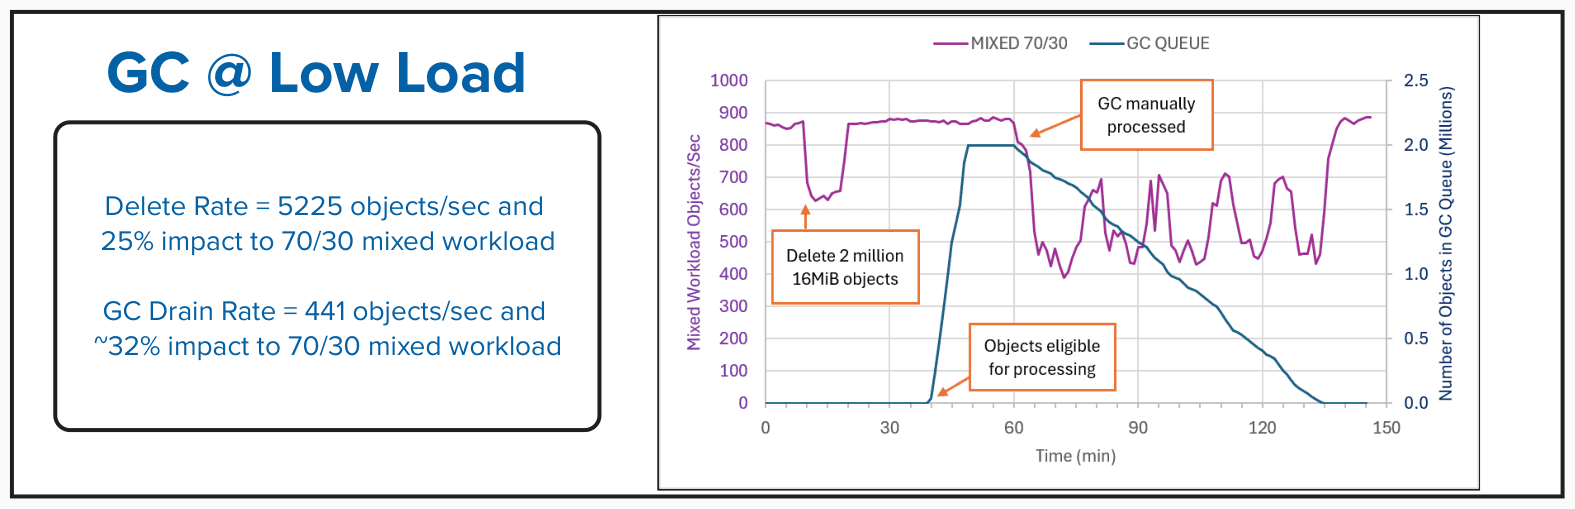
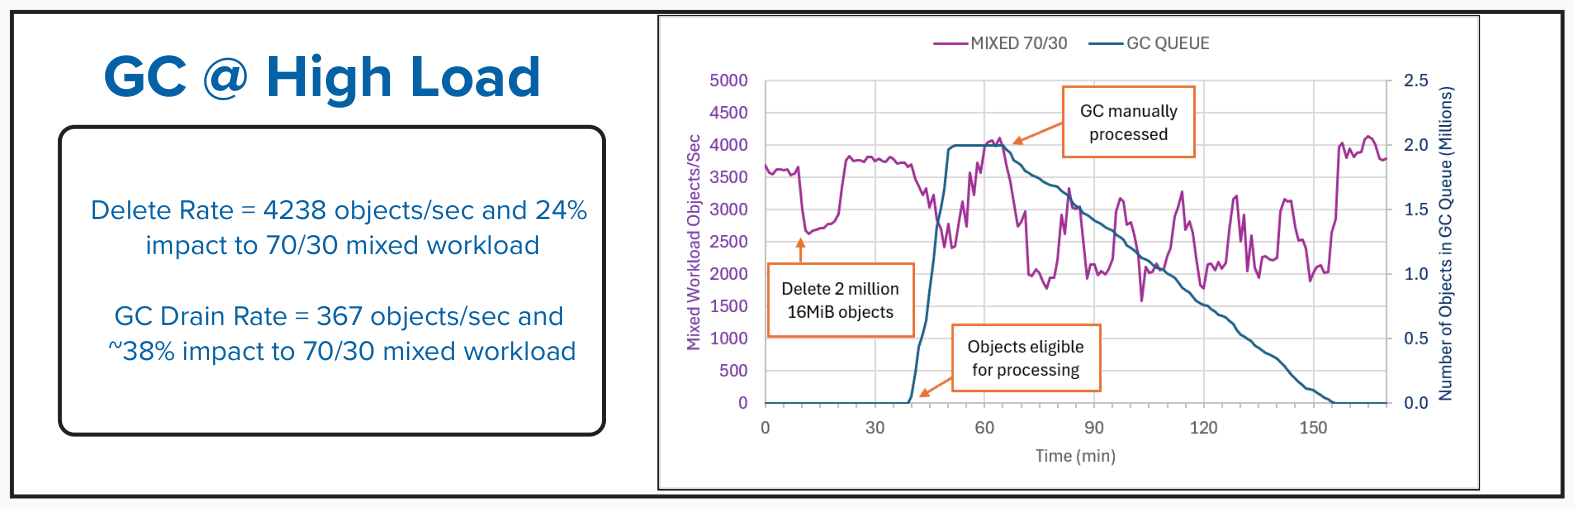 From the garbage collection tests we saw that the background load and GC processing heavily impacted each other. Once the GC process completed, the steady-state client I/O returned to the original performance from before the test began.
| Client I/O Load | None | Low | Medium | High |
|---|---|---|---|---|
| Mixed workload throughput during steady-state (obj/s) | - | 862 | 2187 | 3604 |
DELETE elapsed time (sec) | 269 | 384 | 362 | 474 |
DELETE rate (objects/sec) | 7460 | 5225 | 5552 | 4238 |
| Mixed workload throughput during deletion window (obj/s) | - | 645 | 1660 | 2730 |
| Elapsed time for all entries to show in the GC queue (sec) | 567 | 625 | 662 | 761 |
| GC drain elapsed time (sec) | 925 | 4521 | 5184 | 5441 |
| GC drain rate (objects/sec) | 2161 | 442 | 386 | 368 |
| Mixed workload throughput during GC processing (obj/s) | - | 580 | 1392 | 2442 |
The experiments demonstrated that system resources are limited at higher background loads.
Additional Recommendations for Deploying RGW Instances Dedicated to GC Processing 
For Production-Facing RGWs: Disable GC processing entirely to dedicate all thread and CPU resources to client S3/Swift API traffic. In these examples, client.rgw.<service_id> applies to every RGW daemon of that service.
ceph config set client.rgw.<frontend_service_id> rgw_enable_gc_threads false
For Dedicated GC RGWs: Deploy separate RGW instances (which do not receive user traffic via your load balancer) and ensure their GC loops are active.
ceph config set client.rgw.<gc_service_id> rgw_enable_gc_threads true
At least one RGW in each zone must have rgw_enable_gc_threads set to true, or you must run radosgw-admin gc process yourself. Otherwise the space that deleted objects used is never reclaimed.
Garbage Collection Tuning 
Per Ceph online documentation Ceph RGW config reference, garbage collection can be tuned to be less aggressive or more aggressive.
Lifecycle Processing at 2 Billion Objects 
Test Description: Using boto3, we applied the LC expiration policy to the bucket. Example:
  "Rules": [
    {
      "ID": "expire-metadata-prefix",
      "Status": "Enabled",
      "Filter": { "Prefix": "warehouse/db/table/metadata/" },
      "Expiration": { "Date": "2024-01-01T00:00:00Z" }
    }
  ]
With no client workload running, we ran radosgw-admin lc process to expire the 20 million objects. We then tracked the total objects and processing rate over time. 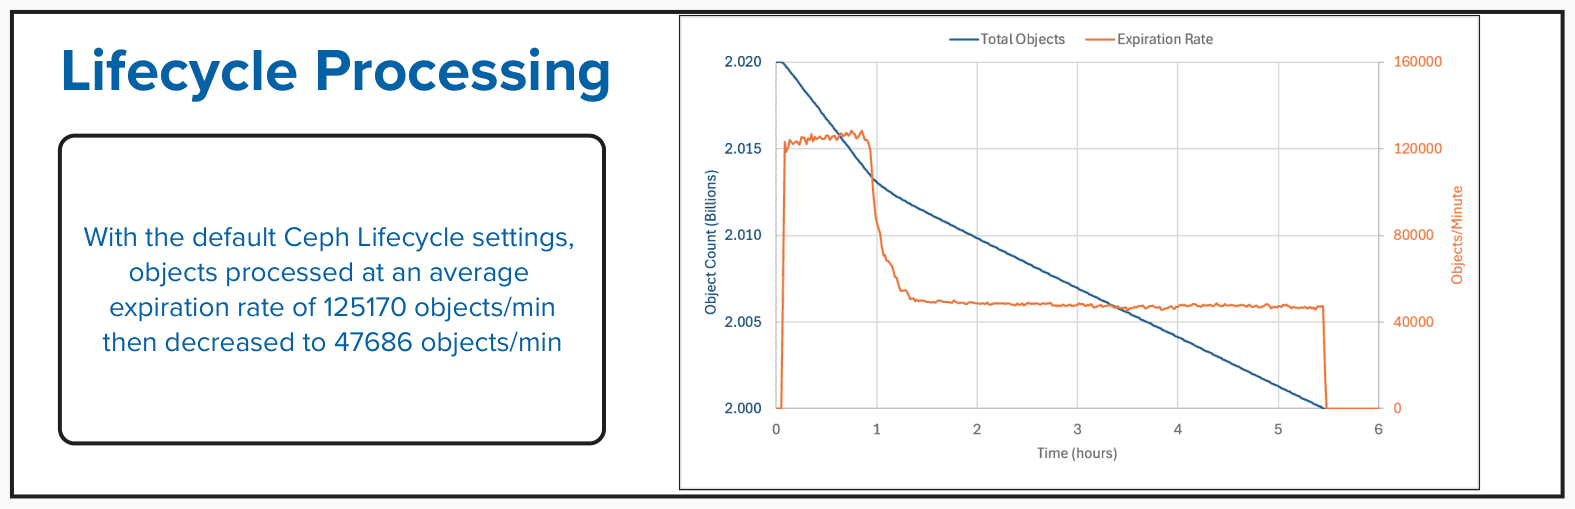
Lifecycle Processing Under Load 
Test Description: Using elbencho, we started up a steady-state mixed workload of 70% GET and 30% PUT at the 64 KiB object size. We let the workload run for 10 minutes, then we issued the boto3 command to apply the expiration policy and ran radosgw-admin lc process to expire the 20 million objects. 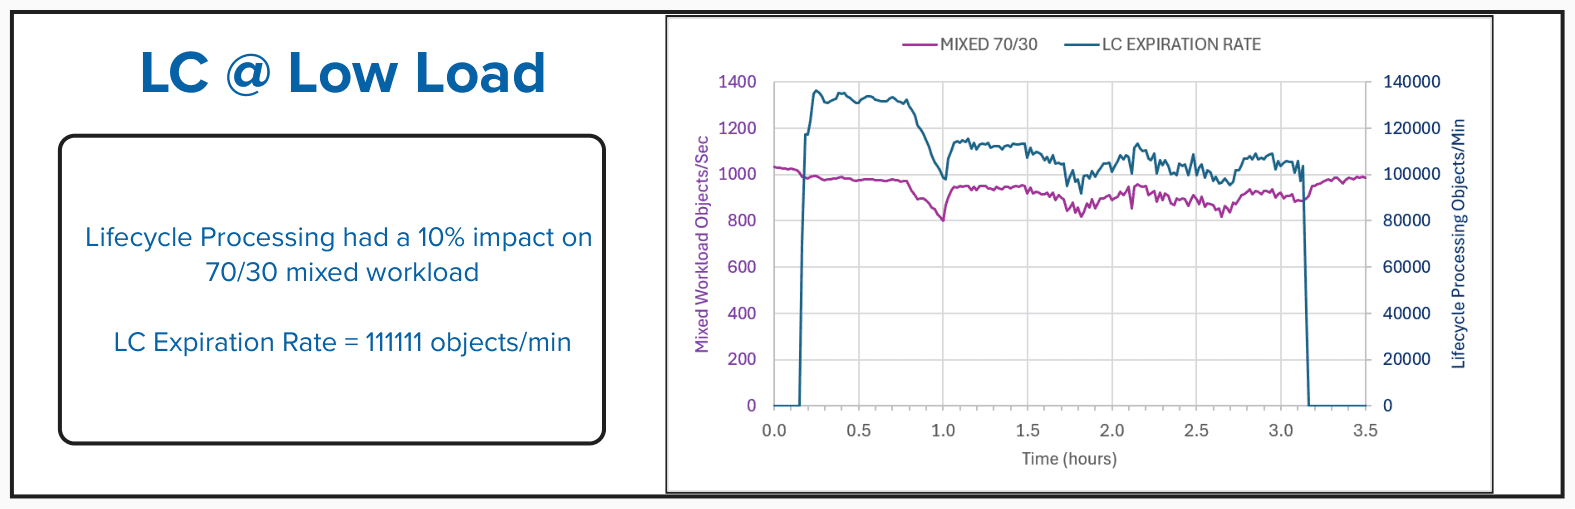
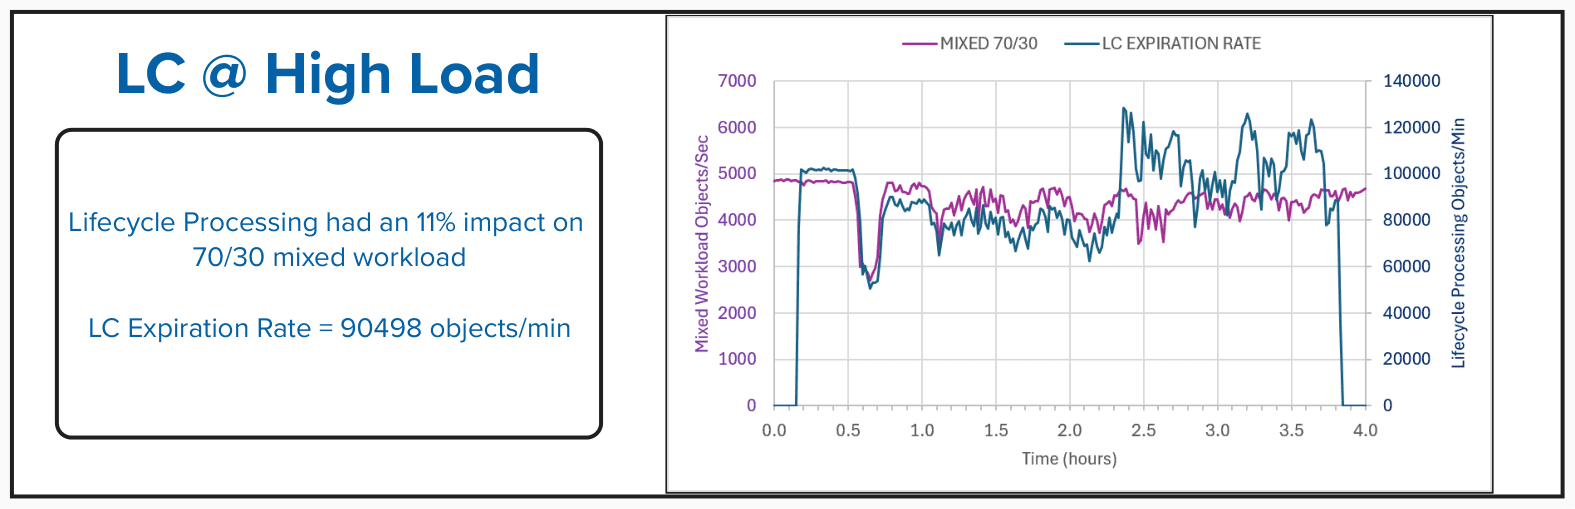 Lifecycle processing finished sooner under load (180 to 221 minutes) than with no load (329 minutes). We repeated the no-load test and saw the same pattern each time: about 125000 objects/min for the first hour, then a slower rate of 47000 objects/min for the rest of the run. We did not find an explanation. The no-load time is therefore a result for this setup, not a fixed baseline.
| Client I/O Load | None | Low | Medium | High |
|---|---|---|---|---|
| Mixed workload throughput (during steady-state) | - | 1024 | 2621 | 4855 |
| Mixed workload throughput (during lifecycle processing) | - | 919 | 2280 | 4302 |
| LC impact to client I/O | - | 10% | 13% | 11% |
| LC elapsed time (min) | 329 | 180 | 188 | 221 |
| LC expiration rate (objects/min) | 60790 | 111111 | 106383 | 90498 |
The lifecycle processing results showed that even when storing billions of objects, their effects on client workloads were modest when dealing with object expiration. Lifecycle processing reduced mixed workload throughput by 10% to 13%. Under load, the heavier the client I/O, the longer lifecycle processing took.
Additional Recommendations for Deploying RGW Instances Dedicated to LC Processing 
For Production-Facing RGWs: Disable LC processing entirely to dedicate all thread and CPU resources to client S3/Swift API traffic.
ceph config set client.rgw.<frontend_service_id> rgw_enable_lc_threads false
For Dedicated LC RGWs: Deploy separate RGW instances (which do not receive user traffic via your load balancer) and ensure their LC threads are active. You can also widen the LC work window and raise the worker counts on these instances. On Umbrella and later, leave rgw_lc_max_wp_worker at its default.
ceph config set client.rgw.<lc_service_id> rgw_enable_lc_threads true
ceph config set client.rgw.<lc_service_id> rgw_lifecycle_work_time 00:00-23:59
ceph config set client.rgw.<lc_service_id> rgw_lc_max_worker 12
ceph config set client.rgw.<lc_service_id> rgw_lc_max_wp_worker 12
At least one RGW in each zone must have rgw_enable_lc_threads set to true. If the parameter is disabled on every RGW, no lifecycle processing happens.
LC Schedule: By default, LC processing starts once a day and runs only during a daily work window, set by rgw_lifecycle_work_time (default 00:00-06:00). When it finishes, it waits for the next window. For heavy workloads, expect LC processing of a large number of expirations or transitions to span multiple days.
Tuning for Lifecycle Processing 
Per Ceph online documentation Ceph RGW config reference, lifecycle processing can be tuned to be more aggressive.
Ceph Cluster Configuration 
| Configuration | Value |
|---|---|
| Upstream Ceph release | 20.2.1 (Tentacle) |
osd_memory_target_autotune | False |
osd_memory_target | 12884901888 |
osd_pool_default_flag_ec_optimizations | True |
osd_pool_erasure_code_stripe_unit | 16384 |
osd noscrub | True |
osd nodeep_scrub | True |
rgw_max_dynamic_shards | 20011 |
rgw_max_objs_per_shard | 100000 |
| Data pool protection | Erasure coding, k=2 m=2 |
| Index pool protection | Replicated, size 3 |
default.rgw.buckets.data | pg_num 4096, pgp_num 4096 |
default.rgw.buckets.index | pg_num 512, pgp_num 512 |
pg_autoscale_mode | off (both pools) |
mon_max_pg_per_osd | 300 |
| RGW daemons | 16 (4 on each of the 4 storage servers, co-located with the OSDs) |
Scrubbing was disabled to keep it out of the measurements. Don't disable it in production.
The elbencho clients connected directly to the 16 RGW endpoints. No load balancer or proxy was used, so the results don't include one.
Storage & Client Node Tunables 
| Configuration | Value |
|---|---|
| Tuned profile | network-latency |
| CPU governor profile | performance |
| C-State profile | C6 Disabled |
Hardware 
| Role | Qty | CPU | RAM (GB) | NVMe OSDs | Network |
|---|---|---|---|---|---|
| Ceph | 4 | 2 x 32-core server CPUs (64 cores and 128 threads in each server) | 512 | 16 x 15.36 TB read-intensive enterprise PCIe Gen 4 TLC NVMe SSDs | 2x 100 GbE bonded with LACP (802.3ad), 200 Gbps aggregate |
| Client machines | 4 | Server CPU @ 2.40 GHz | 256 | - | 2x 100 GbE links (on one dual-port adapter) |
Software 
| Tool | Version |
|---|---|
elbencho | 3.0-37 |
aws s3api | 1.45.5 |
boto3 | 1.43.5 |
s5cmd | v2.3.0-991c9fb |
Conclusion 
This study shows that Ceph can maintain reasonable performance for a large bucket with 2 billion objects. No fundamental issues were found with listing, resharding, deletion, garbage collection, and lifecycle expiration that prevented continued operation even at this large bucket size. Through the tests, it was observed that bucket size was not the limiting factor affecting performance but in fact it was limited to resources of the cluster. There was reduced throughput of object deletion and garbage collection at higher levels of background load in the environment. Overall, the data gathered from these tests show that companies who build large lakehouse, analytics, AI, and archival data can confidently scale buckets into the billions of objects.
Author - Andy Lin (awlin@ibm.com), Editor - Alex Surma (alexander.surma@ibm.com)