Ceph Performance Part 1: Disk Controller Write Throughput
Introduction 
Here at Inktank our developers have been toiling away at their desks, profiling and optimizing Ceph to make it one of the fastest distributed storage solutions on the planet. One question we often get asked is how to build an optimally performing Ceph cluster. This isn’t always an easy question to answer because it depends on many factors including funding, capacity requirements, density requirements, and existing infrastructure. There are however some basic investigations that can be done to start getting an idea of what components in a Ceph storage node matter.
The wise and benevolent management at Inktank (Hi Guys!) agreed to allow me to go on a shopping spree with the corporate credit card to answer these questions. Without further encouragement, I went to one of our hardware vendors and immediately put in an order for a 36-drive Supermicro SC847A chassis along with 36 SATA drives, 9 Intel 520 SSDs, a variety of controllers, and all of the other random bits needed to actually make this thing work.
For those of you that like shiny things, here are some pictures to feast on:
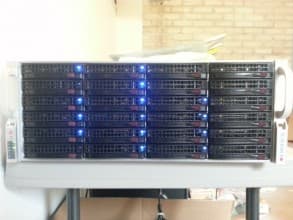
The SC847a in all of its glory.
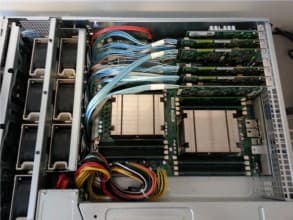
Preview of things to come...
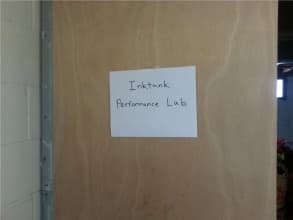
The Inktank "Performance Lab"
Like all too-good-to-be-true deals, there is a terrible price. Somehow a wire got crossed and it turns out that there are certain expectations that come with this gear. Like running tests. Hundreds of them. Maybe thousands! And publishing too! It’s almost indentured servitude. Just look at the “Performance Lab” they make me work in (Yes, that is my basement and yes, I made that sign). My hope is that you, the reader, will benefit from my easily exploited addiction to new toys and read through the articles I am writing that explore Ceph performance on this hardware in alarming detail. Not only will you likely learn something interesting, but it will help me convince the management that this wasn’t a completely hair-brained idea.
Now I know what you are thinking. You want to see that chassis spinning up with all of the drives and SSDs going full blast on all 5 controllers simultaneously. You want my power bill to skyrocket and watch the meter spin around like in “Christmas Vacation” when all of the lights got plugged in. You’ll get that later, I promise (well, not the spinning meter part). For now we’ll explore something that the brass have been hounding me to produce for months: A report detailing how a wide variety of SAS/RAID controller setups handle different Ceph workloads on various OSD back-end filesystems. This first article is using SSDs for the journals as the performance results tend to be more straightforward than when putting journals on the same disk as the data. Later on, we’ll explore how these controllers perform with journals on the same disks.
So without further ado, and to prove I’m not fleecing the company by selling all of these parts on Ebay for booze money, lets get started.
Hardware and Software Setup 
Let me begin by saying the SC847A is a real beast. Even at idle with low voltage CPUs its 7 80x38mm fans spin at 5K RPM. When it’s under heavy load, they spin up to 8K RPM and you can easily hear the thing on the main floor of the house. I imagine I’ve probably already lost a decibel or two of hearing just sitting next to it for a couple of weeks and I’m used to working in data centers. Make sure you know what you are getting into if you decide to stick one of these things under your desk.
Let’s take a look at some of the controllers we’ll be testing today:
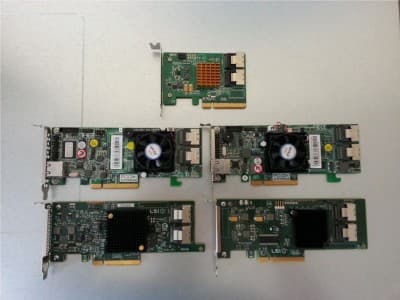
The SAS/RAID Controllers we will be testing.
- High Point Rocket 2720SGL (center top): This is an entry level SAS controller with a marvel 9485 RAID chipset. This particular model has a JBOD mode only firmware and can be had for a measly $150 on the net.
- Areca ARC-1880 (middle left): This is Areca’s previous-generation high end RAID controller. Still considered to be quite fast. Supports disks in JBOD mode, a pass-through mode, and RAID0-6 setups.
- Areca ARC-1222 (middle right): This is a much older Areca RAID controller and is only really being included in this comparison because we happened to have a spare one laying around. Supports disks in JBOD mode, a pass-through mode, and RAID0-6 setups.
- LSI SAS 9207-8i (bottom left): This is LSI’s newest budget controller using the SAS2308 chipset. Interestingly they ship it with the IT/JBOD firmware which does not support any RAID configurations at all. Card can be had for about $240.
- LSI SAS 9211-8i (bottom right): Ah, the 9211-8i. It uses the venerable SAS2008 chipset, widely known and used in ZFS deployments all over the world. It’s basically a SAS controller that supports JBOD mode and very basic RAID0/1 functionality. There appears to be little or no write-through or write-back cache. Can be had for around $225.
- LSI SAS 2208 (not shown): It just so happens that the Supermicro motherboard we purchased has LSIs current higher-end SAS 2208 chipset on it with 1GB of cache and full JBOD and RAID0-6 mode support. LSI’s equivalent standalone card is the SAS 9265-8i, which retails for around $630.
Other hardware being used in this setup includes:
- Chassis: Supermicro 4U 36-drive SC847A
- Motherboard: Supermicro X9DRH-7F
- CPUS: 2 X Intel XEON E5-2630L (2.0GHz, 6-core)
- RAM: 8 X 4GB Supermicro ECC Registered DDR1333 (32GB total)
- Disks: 6 X 7200RPM Seagate Constellation ES 1TB Enterprise SATA
- SSDs: 2 X Intel 520 180GB
- NIC: Intel X520-DA2 10GBE
As far as software goes, these tests will use:
- OS: Ubuntu 12.04
- Ceph: 0.50
- Kernel: 3.4 from source
- Tools: blktrace, collectl, perf
Test Setup 
In this article the focus is specifically on the raw controller/disk throughput that can be obtained, so these tests are being run directly on the SC847a using localhost TCP socket connections. Each controller being tested supports a variety of operational modes. To keep things reasonable we are testing 3 configurations that all use the same number of data and journal disks:
- JBOD Mode (Supported by all controllers in these tests. Acts like a standard SAS controller. 3 10GB Journals per SSD).
- Pass-through/6xRAID0 mode (Supported on the Areca controllers and can be simulated on the SAS2208 by creating a single drive RAID0 for each OSD. Uses on-board write-back cache. 3 10GB Journals per SSD).
- RAID0 Mode (A single OSD on a 6-disk RAID0 array. A single 60G journal is on a RAID0 array made up of the two SSDs). Write-back cache is enabled on the controllers that support it.
There is some controversy surrounding Areca’s JBOD mode as it may actually be using on-board cache and acting more or less the same as their pass-through mode. In the tests we will see that the two modes tend to perform very similarly on Areca hardware which may support this belief.
To generate results, we are using Ceph’s built-in benchmarking command: “RADOS bench” which writes new objects for every chunk of data that is to be written out. RADOS bench has certain benefits and drawbacks. On one hand it gives you a very clear picture of how fast OSDs can write out new objects at various sizes. What it does not test is how quickly small writes to existing objects are performed. This is relevant, because this is exactly what happens when doing small random writes to an RBD volume. In the past we have also noticed that RADOS bench can become a bottleneck at high throughput levels. We are running 8 concurrent instances of the benchmark and aggregating the results to get around this issue.
RADOS bench gives you some flexibility regarding how big objects should be, how many to concurrently keep in flight, and how long the test should be run for. We’ve settled on 5 minute tests using the following permutations:
- 4KB Objects, 16 Concurrent Operations (2 per rados bench instance)
- 4KB Objects, 256 Concurrent Operations (32 per rados bench instance)
- 128KB Objects, 16 Concurrent Operations (2 per rados bench instance)
- 128KB Objects, 256 Concurrent Operations (32 per rados bench instance)
- 4M Objects, 16 Concurrent Operations (2 per rados bench instance)
- 4M Objects, 256 Concurrent Operations (32 per rados bench instance)
For each permutation, we run the same test using BTRFS, XFS, and EXT4 for the underlying OSD filesystems. Filesystems are reformatted and mkcephfs is re-run between every test to ensure that fragmentation from previous tests does not affect the outcome. We left most Ceph tunables in their default state for these tests except for: “filestore xattr use omap = true” to ensure that EXT4 worked properly. We did pass certain mkfs and mount options to the underlying file systems where it made sense:
- mkfs.btfs options: -l 16k -n 16k
- btrfs mount options: -o noatime
- mkfs.xfs options: -f -i size=2048 (-d su-64k, sw=6 for RAID0 tests)
- xfs mount options: -o noatime
- mkfs.ext4 options: (-b 4096 -E stride=16,stripe-width=96 for RAID0 tests)
- ext4 mount options: -o noatime,user_xattr
During the tests, collectl was used to record various system performance statistics, and perf was used to gather profiling data on the running processes. blktrace was also run against every OSD data disk so that we could potentially go back and examine seek behavior on the underlying block devices.
4KB RADOS Bench Results 

Before we dig into these results, I want to talk a little bit about what actually happens when RADOS bench is run. Each instance of RADOS bench concurrently generates and sends multiple chunks of data over TCP socket connections (in this case via localhost) to OSDs in various placement groups. Depending on the replication level of the pool that is targeted, each OSD forwards the data it receives to secondary OSDs in the same placement group. Each OSD must write its data out to the journal (or potentially the data disk in the case of BTRFS) before it can send an acknowledgement to the sender that the data has been written. When data is written to the journal, it is appended to where the last bit of data left off. This is ideal behavior on spinning disks because it means that fewer seeks are needed to get the data written out. Eventually that data must be written to the OSD data disk. Significantly more work needs to be performed (which tends to mean significantly more seeks) due to all of the various things the file system needs to do to keep track of and place the data. This only gets worse as the file system gets older and fragments in exciting ways. It is important to keep this in mind, because it can have a dramatic effect on performance.
Are these results reasonable? The journals are on SSDs which have been carefully chosen to exceed the throughput and IOPS capabilities of the underlying data disks. This should hopefully keep them from being a bottleneck in this test. The data disks, which are 7200RPM SATA drives, are capable of about 150-200 IOPS each. With 4KB IOs and 6 disks, that’s something like 4MB/s aggregate throughput assuming there is no write coalescing happening behind the scenes. Given these results, it doesn’t really look like much coalescing is happening. It’s also possible however, that write coalescing is happening and that some other bottleneck is limiting us. We have blktrace results, and in another article it would be interesting to dig deeper into these numbers to see what’s going on.
What else can we say about these results? The most obvious thing is that JBOD mode seems to be doing the best, while single array RAID0 configurations appear to be universally slow. It’s entirely possibly that tweaks to various queue limits or other parameters may be needed to increase single OSD throughput in these kinds of setups. The other thing to note here is that BTRFS appears to combine well with JBOD modes. Lets take a look at some of the system monitoring data gathered with collectl during the tests to see if it gives us any clues regarding why this is. Specifically, we will look at the average CPU utilization, the average IO wait time for the OSD data disks, and the average IO wait time for OSD journal disks.
(Note from the future: The images in this article were restored in 2026 but we only had the thumbnails. Enlarging the images is no longer possible)
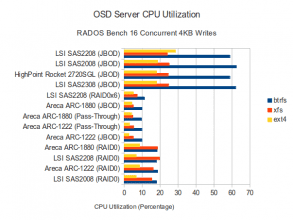
CPU Utilization
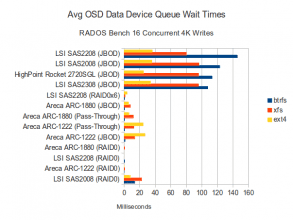
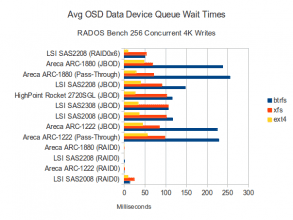
Data Disk Waits
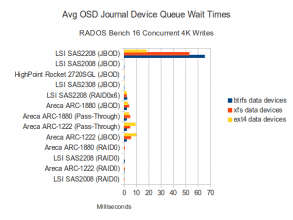
Journal Disk Waits
Very interesting! CPU Utilization is highest in JBOD modes which makes some sense given that a certain amount of processing is necessary for every object written and those modes are the fastest. The CPU utilization used during the BTRFS tests in JBOD mode are particularly high though! The top performing combinations (i.e. JBOD mode with BTRFS) also have the highest wait times. My reading of this is that in those cases the spinning disks are working pretty hard for the throughput they are getting and are probably performing a lot of seeks. In non-JBOD modes, I suspect there is a bottleneck somewhere else and the disks aren’t being stressed as hard.
The journal wait times are also interesting. I think these results are hinting that while the cheap/basic SAS controllers are showing no wait times at all for the journal disks (They shouldn’t; the SSDs should easily be out-pacing the spinning disks on this kind of workload), the more expensive RAID controllers appear to be introducing extra latency, probably due to the extra caching and processing they do. Despite this, the fastest performing configuration was the SAS2208 in JBOD mode with BTRFS, which also had the highest journal queue wait times!
Let’s see if these trends continue if we up the number of concurrent operations:

The performance on the higher-end RAID controllers has improved quite a bit, but only in configurations that involve multiple OSDs. Having higher concurrent op counts may let these controllers hide latency introduced on the journal disks. Single OSD RAID0 performance on the other hand has pretty much remained the same. I suspect that whatever bottleneck was holding back the single OSD RAID0 performance is still present and neither the disks nor the controllers are being taxed particularly hard. JBOD performance likewise saw little improvement. In this case though, writes are already backing up in the disk queues so throwing more operations at the problem isn’t helping. Let’s see if my theories pan out:
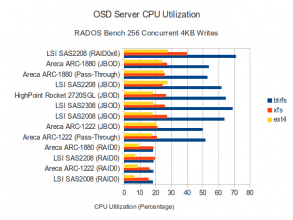
CPU Utilization
Data Disk Waits
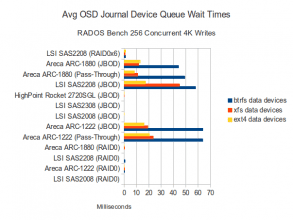
Journal Disk Waits
The performance of pass-through configurations on the RAID controllers increased to match the cheaper SAS controllers, but so did the CPU utilization. Average data disk and SSD journal queue wait times increased dramatically on the Areca controllers as well. It appears that this workload is doing a good job of backing up operations. Having said that, it doesn’t necessarily seem to be impacting the overall throughput as the ARC-1880 still does quite well in this test.
128KB RADOS Bench Results 

With 128K writes the story looks pretty similar with a couple of exceptions. JBOD configurations utilizing BTRFS are again quite fast, especially on the cheaper SAS controllers and the SAS2208. On the other hand, the 6 OSD RAID0 configuration on the SAS2208, which was fastest configuration in the 256 concurrent 4KB tests, is one of the slowest configurations in this test. Single OSD RAID0 modes are again generally slow. XFS performance appears to be universally slow while EXT4 is generally somewhere in-between XFS and BTRFS.
Click on any of the images below to enlarge them…
CPU Utilization
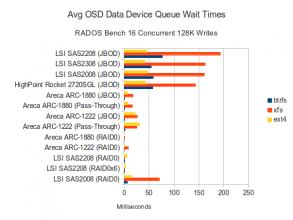
Data Disk Waits
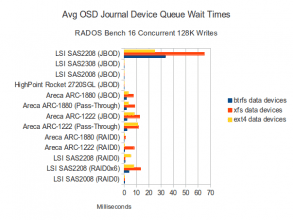
Journal Disk Waits
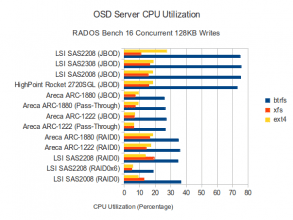
With 16 concurent 128K operations, BTRFS is generating higher CPU Utilization in every configuration on every controller. This is especially true on configurations where BTRFS performs well, but is still true on configurations even where BTRFS is relatively slow. Data disk wait times are again higher on the faster configurations, though interestingly, wait times have decreased for BTRFS while they have increased for XFS. EXT4 wait times have remained roughly the same. On the journals, the SAS2208 in JBOD mode is again showing the highest IO queue wait times, but is also one of the fastest configurations.

With 256 concurrent operations, the pass-through and 6 OSD RAID0 modes again show significant improvement, while the single OSD RAID0 modes remain slow. BTRFS continues to dominate in terms of performance, while EXT4 puts in a relatively decent showing on the Areca ARC-1880 and LSI SAS2208.
Click on any of the images below to enlarge them…
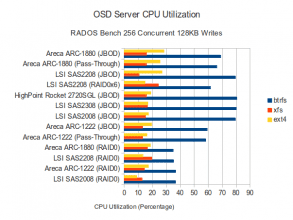
CPU Utilization
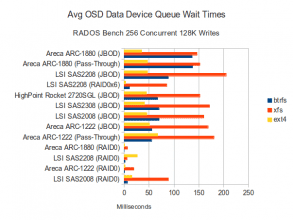
Data Disk Waits
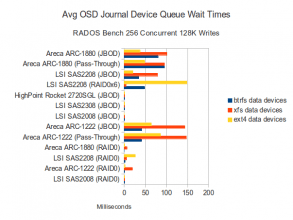
Journal Disk Waits
In the configurations where BTRFS throughput increased relative to the 16 concurrent operations test, CPU utilization also increased dramatically. EXT4 CPU Utilization appears to be fairly low, even when EXT4 performed within 70-80% of BTRFS. XFS is again resulting in high IO wait times on a variety of controllers. BTRFS wait times appear to be high on the ARC-1880 as well. On the SSD side, it looks like the RAID controllers with write back cache are again showing relatively high IO wait times for journal writes.
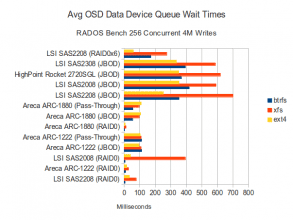
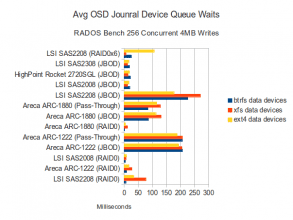
4MB RADOS Bench Results 

Wow! With just 16 concurrent IOs, we’ve got the three cheapest controllers in the bunch pushing over 600MB/s with EXT4, and nearly 700MB/s with BTRFS. In JBOD mode (and pass-through on the ARC-1880), BTRFS is still getting a bit over 600MB/s, but neither XFS nor EXT4 can keep up. In a surprising twist, EXT4 on the ARC-1880 is able to push around 550MB/s with a single OSD using a 6-drive RAID0 array. This is the first time we’ve seen a RAID0 configuration get anywhere close to the performance of the 6 OSD configurations and may warrant further investigation in a later article.
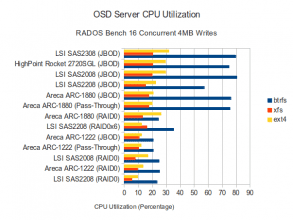
CPU Utilization
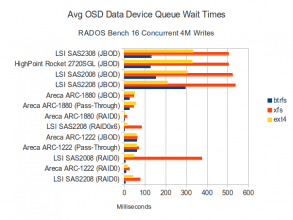
Data Disk Waits
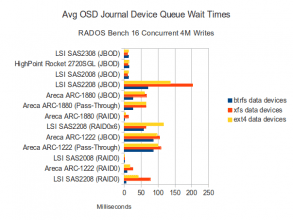
Journal Disk Waits
There is nothing particularly new here. High CPU Utilization for the BTRFS configurations. EXT4 configurations appear to be much easier on the CPU, even when pushing nearly as much data at BTRFS. XFS is showing much higher data disk wait times while providing lower throughput than EXT4 or BTRFS. Presumably if we looked at the blktrace data we would see higher seek counts on the data disks using XFS. We can verify this in a later article by using a tool called seekwatcher with the blktrace data that was recorded. Queue wait times in JBOD modes that by-pass any on-board cache appear to be fairly high, while modes that utilize cache appear to be low. Conversely, wait times on the SSD journal disks remain quite low on the 3 SAS controllers, but are higher to varying degrees on the RAID controllers.

With 256 Concurrent IOs the story is even better: Of the 6 controllers, 4 are all capable of pushing over 130MB/s per disk when using BTRFS That’s nearly 800MB/s aggregate throughput to the 6 OSD data disks, and with journal writes, 1.6GB/s total throughput to the controller. Not bad! EXT4 performance is still good, but doesn’t seem to improve much with more concurrent IOs.
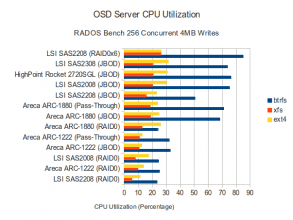
CPU Utilization
Data Disk Waits
Journal Disk Waits
CPU usage, data disk waits, and journal disk waits are all very similar to what we saw with 4MB writes and 16 concurrent IOs. No surprises here.
Conclusion 
So after hours of benchmarking and various machinations to keep Libre Office from crashing while compiling the results, what have we learned? In general, JBOD modes tend to do well, especially with BTRFS. Single OSD RAID0 throughput is poor across the board with a couple of exceptions. BTRFS shows the highest throughput numbers but also results in significantly higher CPU usage than either XFS or EXT4. RAID controllers utilizing write-back cache seem to reduce the queue length times for IOs going to the data disks, but it isn’t entirely clear if it is cache or lower throughput that causes this. Curiously those same controllers show higher queue wait times for the SSD journal disks, despite those drives having very low queue wait times on the cheaper SAS controllers.
Lets look at how each controller did in these tests individually. Please keep in mind that these conclusions may not be applicable for configurations where the journals are on the same disks as the data.
- High Point Rocket 2720SGL: This controller never has the highest performance across the board, but it consistently has very high BTRFS performance and is extremely cheap. From strictly a performance perspective, this is a very strong option if targeting a JBOD configuration with BTRFS.
- Areca ARC-1880: The ARC-1880 did well in some cases and poorly in others. It didn’t do great with few small concurrent IOs, but was much better and even leading the pack with many concurrent IOs at times. It also did better with EXT4 than many other controllers. At large IO sizes it does alright, but can’t keep up with the much cheaper controllers running in JBOD mode. To be fair, the newer ARC-1882 may do better in the places where the ARC-1880 didn’t excel.
- Areca ARC-1222: The ARC-1222 is an old card and it shows. It typically hangs out near the bottom of the pack across all of the tests. It suffers with few concurrent IOs just like the ARC-1880, but doesn’t have high enough throughput to compete at large IOs either. Probably not worth buying, even if you see one cheap on Ebay. There are better affordable options.
- LSI SAS 9207-8i: This controller does very well in BTRFS modes and often is neck-and-neck with the 2720SGL. It is more expensive, but comes from a slightly more recognized brand. If you want a cheap controller and the thought of buying a highpoint is unappealing to you, this is the controller for you.
- LSI SAS 9211-8i: In JBOD mode the SAS9211-8i performs very similarly to the SAS9207-8i and the 2720SGL. Its RAID functionality is almost an afterthought and performs quite poorly with Ceph. This card is worth picking up if you find one for a good price, but the 9207-8i is typically slightly cheaper and has slightly better specs.
- LSI SAS 2208: The SAS2208 is an interesting controller. In JBOD mode its behavior mimics the cheaper controllers and does well with BTRFS, but is typically slightly slower. With 6 single disk RAID0 arrays, it sometimes does extremely well and is the highest performing option, while at other times it falls flat on its face. Similar to the ARC-1880, this controller seems to be friendlier to EXT4 and even XFS in some cases, possibly due to the on-board write-back cache. This controller shows curiously high SSD queue wait times in some cases.
Future Work 
This article provides a high level view of how several different controllers perform with Ceph. There are many more tests and additional analysis that could be done in future articles. If you have an opinion on what you’d like to see, please send me an email or leave a comment for the article. Here are some of the things that might be interesting to investigate in a future article:
Wider Analysis:
- Run tests using 8 spinning disks with journals on the same disks instead of 6 spinning disks and 2 SSDs for journals.
- Examine how performance scales with multiple controllers and more disks/ssds in the same node.
- Examine how performance scales across multiple nodes (Get out the credit card Inktank!).
- Test performance with a separate client using 10GbE and potentialy bonded 10GbE when more drives are in use.
- Additional tests including object reads, rbd throughput tests, cephfs throughput tests, metadata tests, etc.
Deeper Analysis:
- Investigate per-process cpu usage, especially in situations where cpu usage is high.
- Examine how performance degrades over time.
- Examine underlying block device performance and seek behavior in a variety of conditions.
- Examine how various tuning parameters affect performance, especially at small IO sizes and on fast RAID arrays.
