Public telemetry dashboards
It is our pleasure to announce the immediate availability of dashboards based on the data reported via Ceph's telemetry feature.
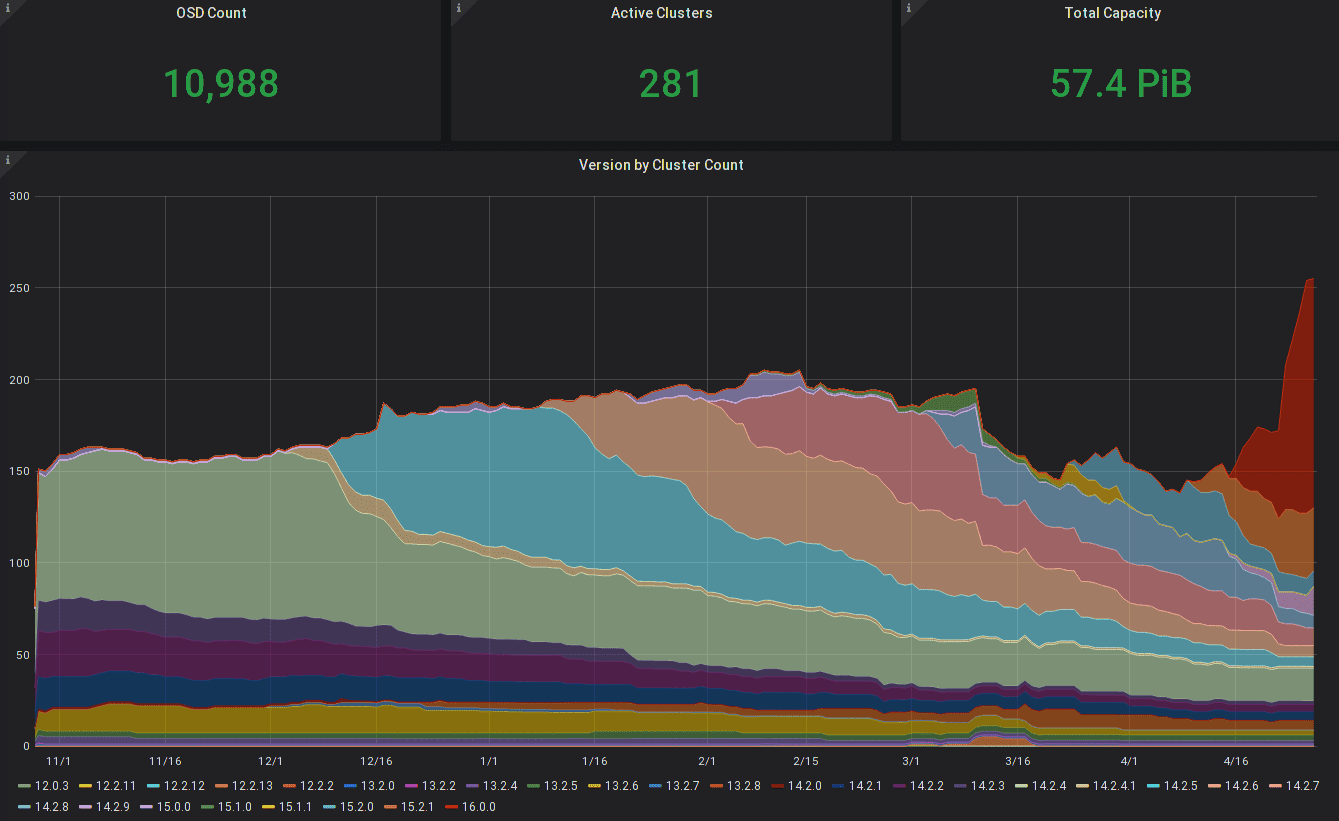
Ceph versions used by clusters, weighted by daemon, over time
Introduced with Ceph Mimic, Ceph telemetry after opt-in sends aggregated, anonymous statistics about how Ceph is being used and deployed to the Ceph Foundation's community infrastructure under the CDLA-1.0 Sharing.
The new dashboards, courtesy of Yaarit Hatuka, Dan Mick, and Lars Marowsky-Brée, allow the community to quickly see summary statistics on how many clusters are reporting, their total capacity and OSD count, and version distribution trends.
The interactive and dynamic version graphs allow to show only major versions or split out minor versions; they can further be filtered by major or minor versions and daemon type (currently only MON or OSD).
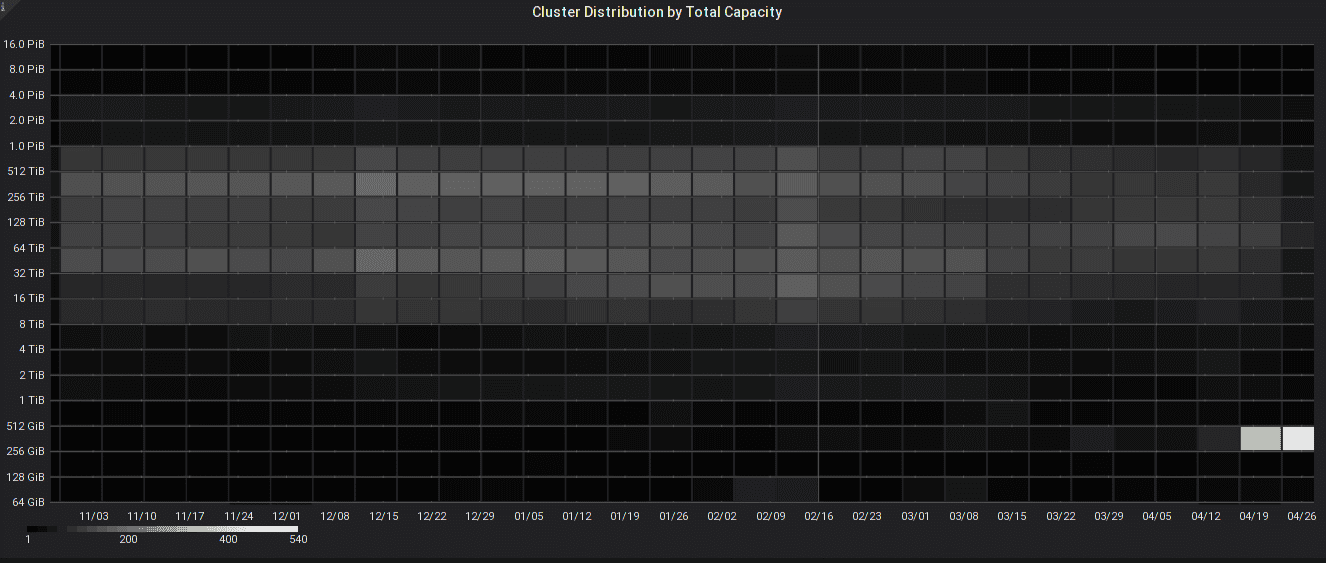
Heatmaps allow insight into how the distribution of cluster sizes and OSD count changes over time:
A whole page is dedicated to show how the quartile distribution of various ratios changes; or in simpler terms, if you have ever wondered what the median OSD (storage device) size in a cluster above 1 PiB is, or whether your cluster capacity would place you into the top 25% of all clusters worldwide, we've got the data for you:
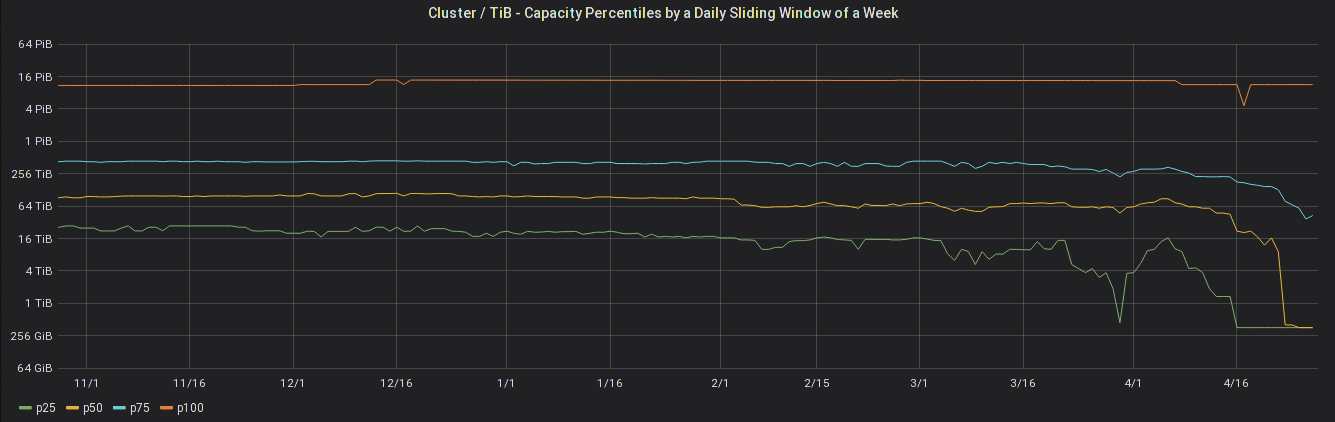
Capacity quartiles over time
To allow for different reporting intervals or transient transmission issues, the charts show a moving average of seven days.
Individual cluster x-ray 
Further, administrators of Ceph clusters can also use the individual cluster dashboard and review the reports that have been received for a given cluster:
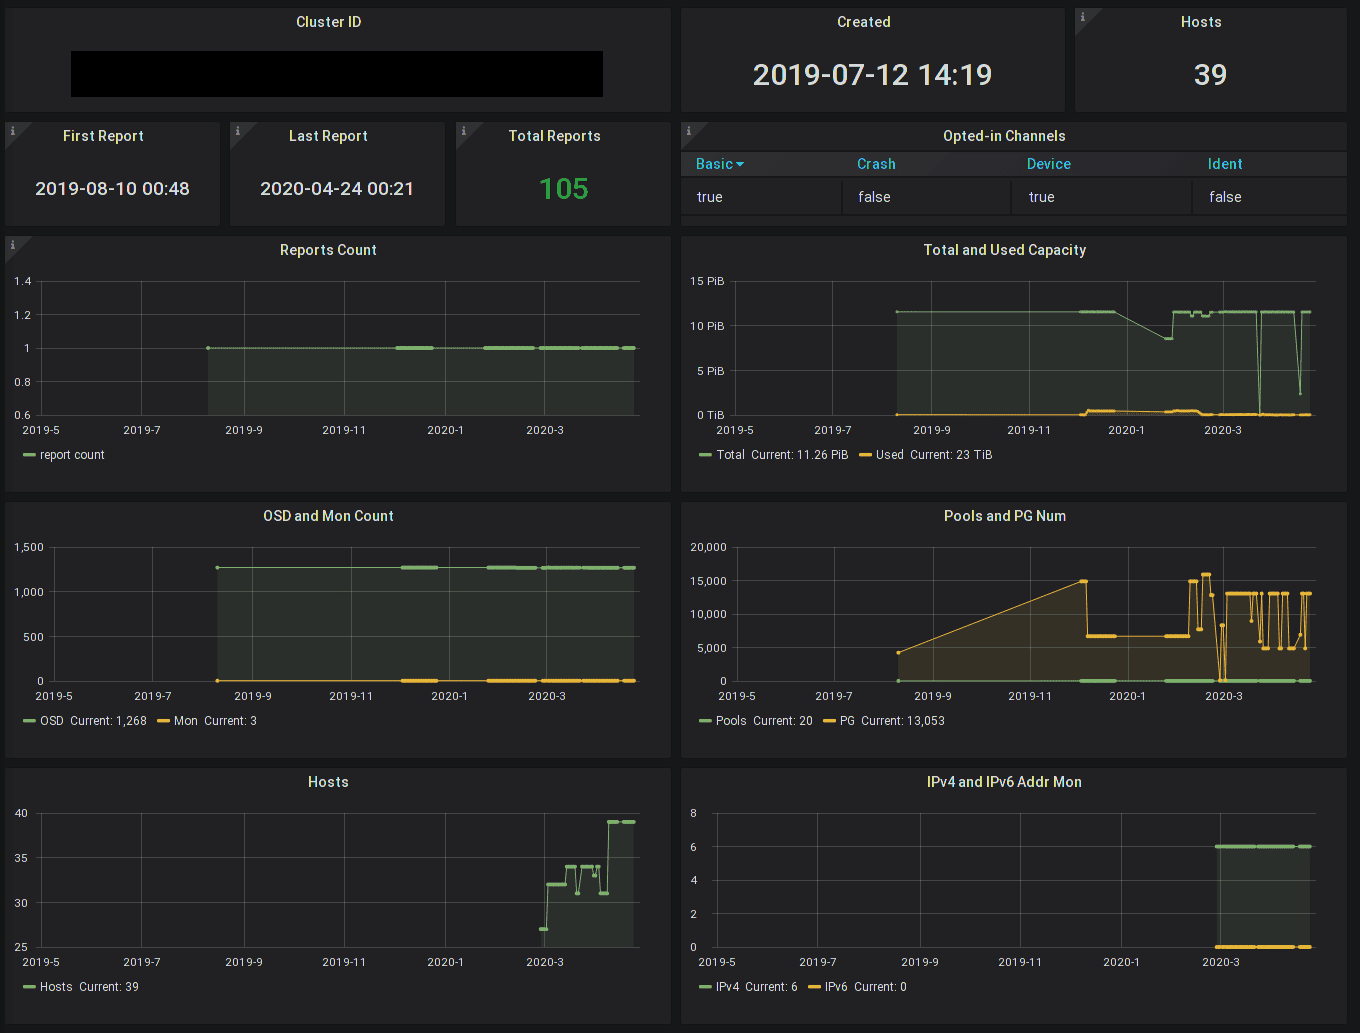
This requires knowing the report_id of the cluster, which serves as the cluster's unique cluster id in the telemetry world. This is an unguessable 128bit random identifier that is generated on the local cluster, and can be viewed with ceph telemetry show | grep report_id. (You can also reset this identifier if you wish to disassociate a cluster's history.)
Administrators can thus easily verify whether the cluster has sent in reports after enabling telemetry, view high-level aggegrate statistics, and even complete prior reports in the database. As an administrator, you will find this updates live with each report your cluster sends in.
How users benefit from Telemetry 
Understanding how Ceph is used is crucial in understanding where to focus our efforts and prioritize new features as well as gauge the impact of any potential issues.
It ensures your use of Ceph is known to the community, and your needs are included in every single decision made. While we run annual surveys, survey data is prone to typos and, being mindful of your time, we cannot possibly ask all the minor detailed questions as often as we'd like. Hence, surveys remain excellent tools for qualitative analysis and cross-validation, but telemetry supplements them with live, automated, and detailed data.
Insights from telemetry have also already helped us identify errors in our documentation as well as bugs in the code. This exploration of the Telemetry dataset using pandas discusses the benefits of Ceph Telemetry users as well.
In addition to you being able to review the telemetry data via the cluster x-ray feature, you may also choose to share the report_id with a support engineer of your choice to allow them access to the history of the cluster and provide more effective support.
For this to be most effective, the Ceph Telemetry database needs to grow to be representative; as we can see from the low number of clusters reporting today, it is not yet.
So please, consider enabling it in your clusters via ceph telemetry on
More details on the configuration (such as using it behind proxy servers) are also available in the documentation.
Future roadmap 
As we work to analyze the data further, we will start answering more sophisticated questions about the dataset in a transparent and interactive fashion. (Such as in this exploration using pandas.)
This will include system reliability and crash trace analysis, and also device reliability data. We will both improve the quality and quantity of our dashboards as well as the data reported.
Some of you may want to enable Ceph Telemetry, but cannot, since an HTTPS endpoint - even via a proxy - is not reachable from your cluster. We are investigating alternate transports to make this possible. And since understanding deployments is particularly useful for mapping safe upgrade paths, enhancements to Ceph Telemetry are candidates for backports.
The Ceph Dashboard used to manage an individual cluster will be further enhanced to configure, review, and reference telemetry data.
Rest assured that data privacy is at the top of our minds; any non-trivial bugfix and especially new metrics to be included will only come into effect if you re-affirm your opt-in.
Get in touch 
Please feel free to contact us via our #ceph IRC channel or via our ceph-users mailing list! We are looking forward to your feedback and ideas.
In conclusion 
We hope that this proves useful and encourages more administrators to enable the functionality in their clusters, and hope to see the number of participating Ceph clusters grow quickly!