Part - 4 : RHCS 3.2 Bluestore Advanced Performance Investigation
Introduction 
Recap: In Blog Episode-3 We have covered RHCS cluster scale-out performance and have observed that, upon adding 60% of additional hardware resources we can get 95% higher IOPS, this demonstrates the scale-out nature of Red Hat Ceph Storage Cluster.
This is the fourth episode of the performance blog series on RHCS 3.2 BlueStore running on the all-flash cluster. In this episode, we are going to review the performance results of various RHCS configurations that will help us take rational decisions to build a Red Hat Ceph Storage configuration that will give us the best performance possible with the current hardware and software available in the lab. For your convenience this blog post has been divided into multiple short benchmarking sections, Enjoy Reading !!
Benchmark 1: 4 OSDs vs. 2 OSDs per NVMe Device 
Key Takeaways 
- With RHCS 3.2 BlueStore 2 OSDs/NVMe is the ideal ratio
- 4 OSDs/NVMe consumes more CPU resources than 2 OSDs/NVMe configuration and provides diminishing returns for IOPS
Summary 
Historically for Ceph Filestore OSD backend, the recommendation for OSD count to NVMe device was generally prescribed to be 4 OSDs/NVMe. With recent improvements in Ceph OSD subsystem and more specifically with the General Availability of Bluestore OSD backend, it's possible to achieve much higher performance per OSD, as such deploying more than 2 OSD per NVMe device provides diminishing returns. In this benchmark, we wanted to back our hypothesis that 2 OSDs / NVMe device is the best configuration.
Graph-1 demonstrates that there are no change in aggregated IOPS across 2 OSDs/NVMe and 4 OSDs/NVMe configurations. Interestingly the CPU utilization with 2 OSDs/NVMe configuration found to be better (lower). In addition to this 2 OSDs/NVMe resulted in lower average latency compared to 4 OSDs/NVMe configuration as shown in Graph-2. As such this validates our hypothesis that RHCS 3.2 BlueStore backend requires a lower number of OSDs per NVMe device (2 OSDs/NVMe) compared to FileStore backend that needed 4 OSDs/NVMe.
RHCS 3.2 Bluestore with 2 OSDs/NVMe configuration delivers the following advantages compared to 4 OSDs/NVMe
- Lower latency for small random writes.
- Bigger Bluestore Onode cache per OSD.
- Lower CPU usage per OSD.
- More total memory and vCPUs available per OSD, increasing the resiliency and stability of the Ceph cluster.
- Having fewer OSDs removes pressure from the RocksDB/WAL device.
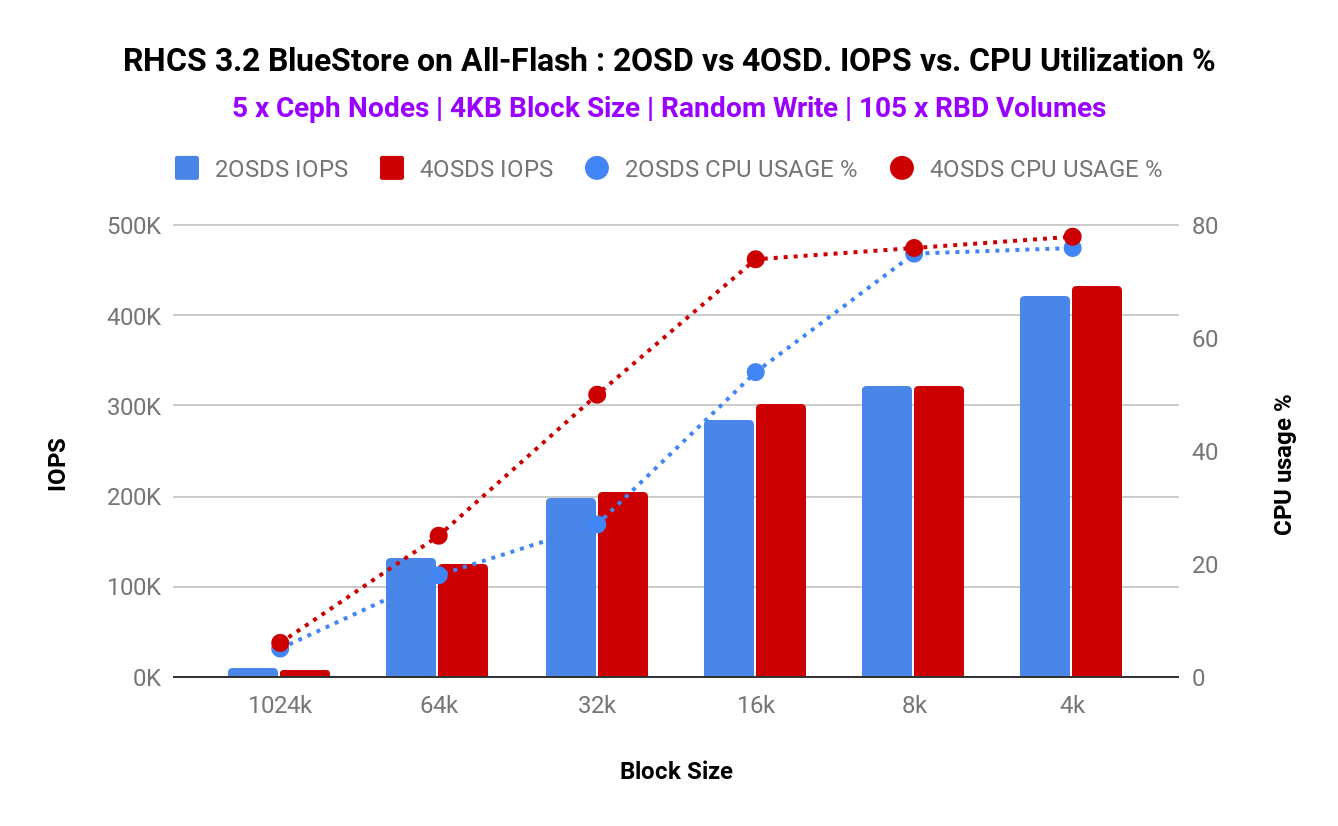
Graph 1 . 2 OSD vs 4 OSD Node CPU Utilization
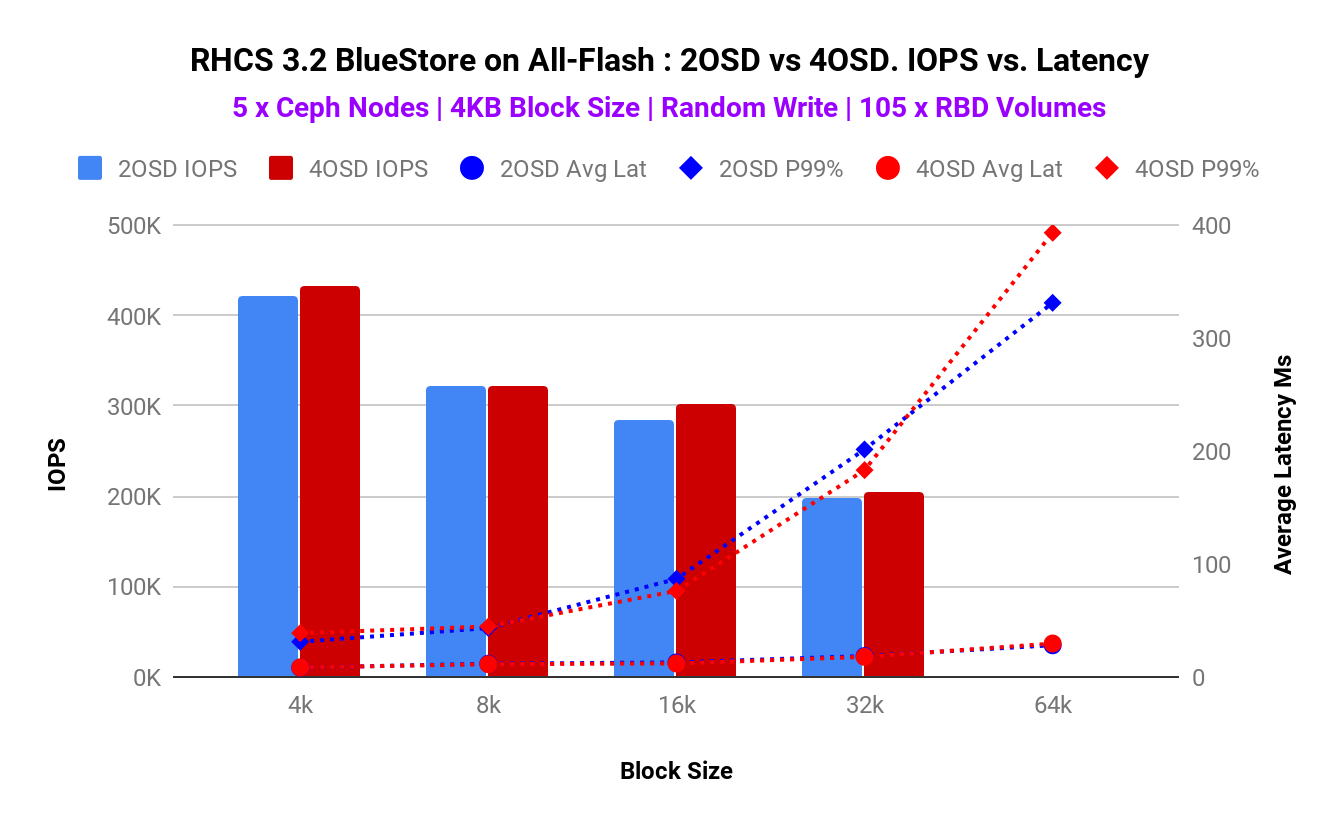
Graph 2. 2OSD vs 4OSD Latency vs IOPS
Benchmark 2: CPU Core to NVMe Ratio 
Key Takeaways 
- For all-flash cluster, adding physical cores helps to increase the number of IOPS for Random Write and 70R/30W mix workload, until limited by CPU saturation.
- With RHCS 3.2 BlueStore OSD backend, the optimal physical CPU core to NVMe ratio was found to be 6:1. With the previous generation of Ceph OSD backend (FileStore), this ratio was used to be 10:1, so BlueStore brings significant improvement also to CPU utilization.
Summary 
This test aims to find optimal CPU physical core to NVMe ratio geared towards performance. From the results in graph 3 we can see that for random write and mixed workloads(70% read, 30% write) we get higher IOPS count as we increase the CPUs. This is in line with what we have seen in the results of our previous tests with small blocks where the limiting factor has been the CPU. For Random Reads there is almost no gain when moving from 6 to 8 cpus, this also makes sense, if you recall the graph where we showed the media utilization for Random Read 4Kb workloads, the media was pretty busy around 88% utilized.
So from the results, we can infer that, with RHCS 3.2 BlueStore, 6 CPU cores / NVMe is the optimal ratio for a variety of workload patterns. Increasing the CPU beyond 6 provides diminishing returns and might not justify the cost involved. It's also worth noting that with the last generation of Ceph OSD backend i.e. FileStore, this ratio used to be 10 CPU cores/NVMe. Hence RHCS 3.2 with BlueStore not only delivers improved performance but also requires lower system resources.
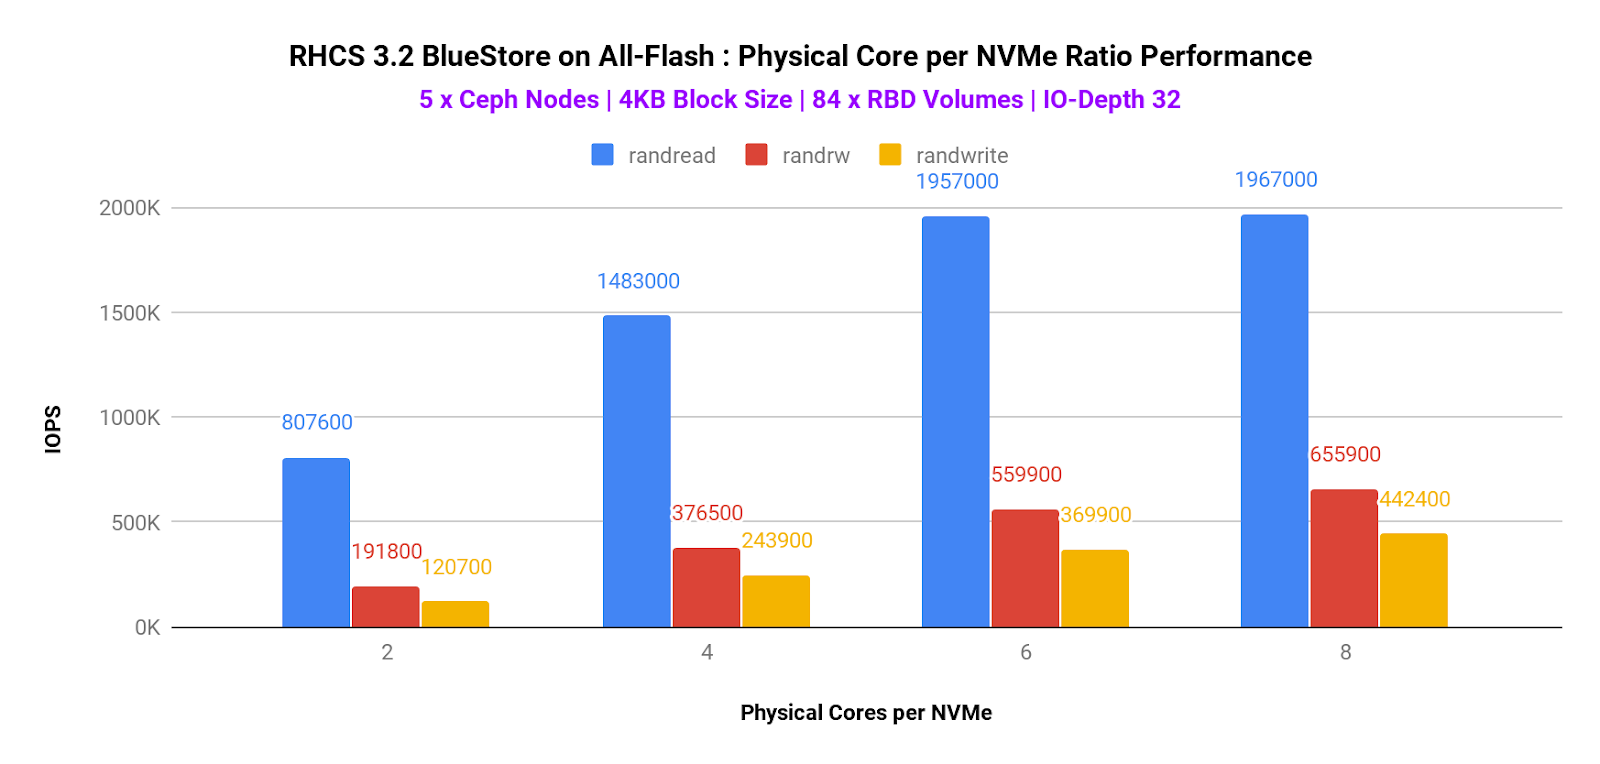
Graph 3. Physical Core per NVMe Ratio Performance
| RHCS 3.2. Physical Cores per NVMe IOPS increase 4Kb | ||
| IOPS Increase from 4 to 6 Cores | IOPS Increase from 6 to 8 Cores | |
| Randread | ▲ 31.96% | ▲ 0.51% |
| Randrw | ▲ 48.71% | ▲ 17.15% |
| Randwrite | ▲ 51.66% | ▲ 19.60% |
Table 1. IOPS Percentage increase from 4 to 6 to 8 physical Cores. Block Size 4Kb
Benchmark 3: Pool Replica 2 versus Pool Replica 3 
Key Takeaways 
- 2x replica pool delivers approx 30% higher IOPS and approx 50% reduced average and tail latency compared to 3x replicated pool
- Random read workload stayed the same, irrespective of pool replication size
Summary 
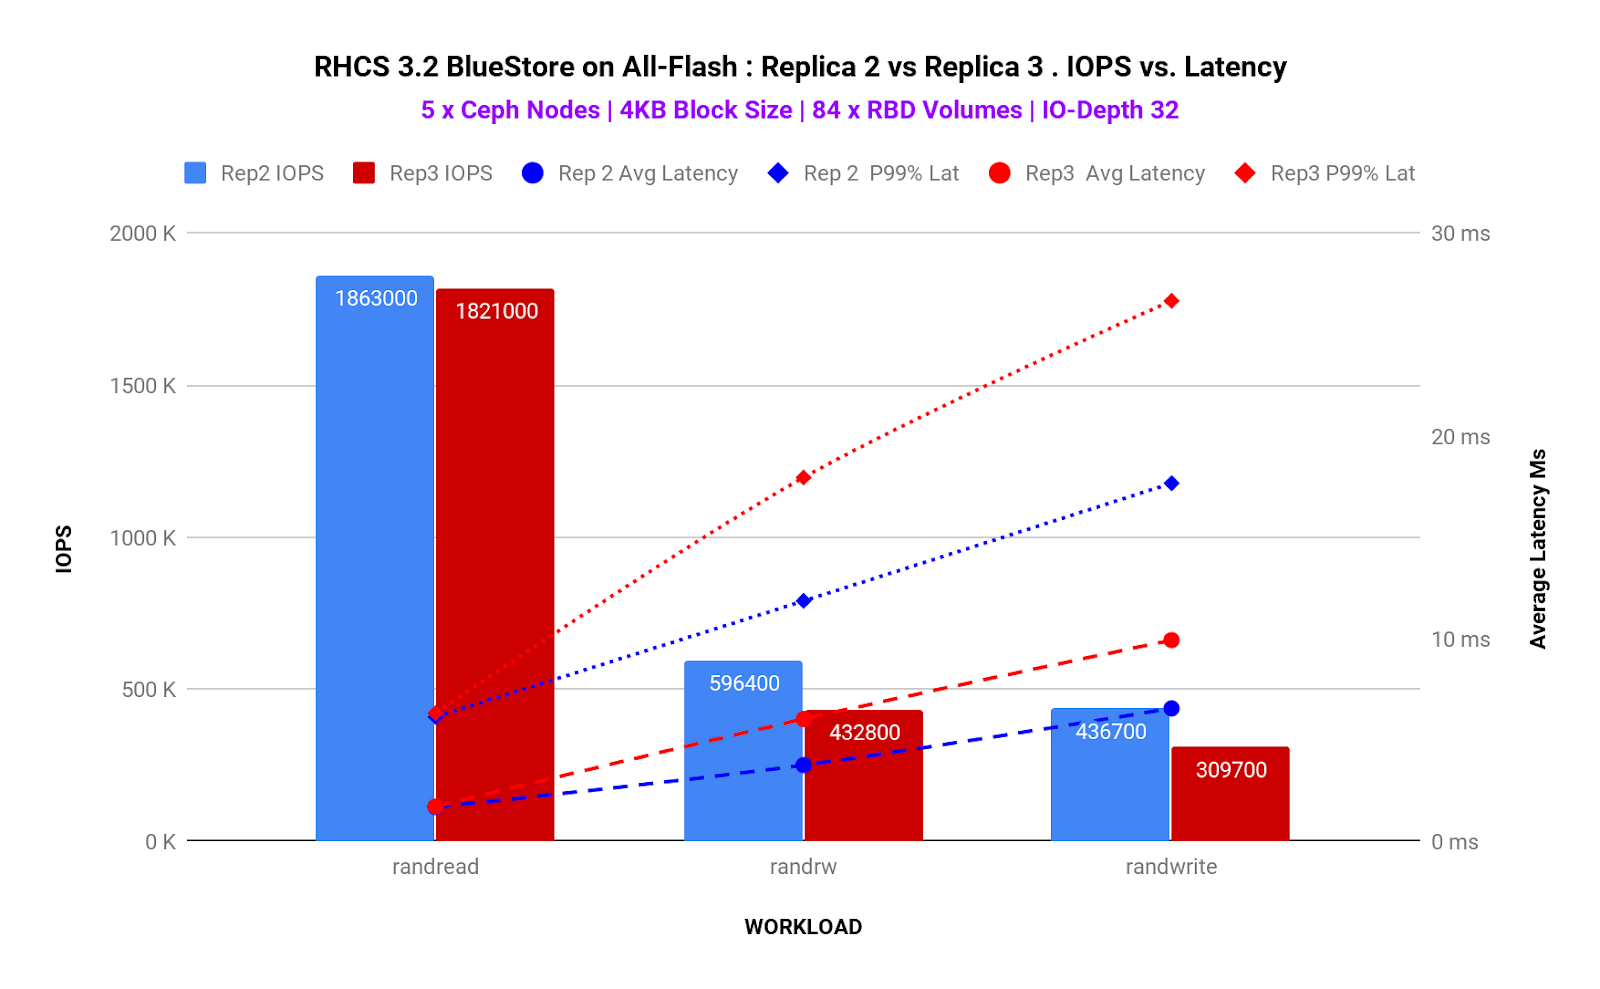
Based on multiple testing done by Red Hat Storage performance teams as well as Ceph community, it is evident that 2x replicated pool perform better than 3x replicated pools as with 2x Ceph OSDs have to write less data hence delivers higher performance. However, this question becomes relevant when we need to know how IOPS, average and tail latency compares between 2x vs. 3x replicated pool on an all-flash Ceph cluster. This test captures all of the above.
In Graph 4 we can observe that there is a performance tax to pay when using 3 replicas. As such 2x replica pool delivers approx 30% higher IOPS and approx 50% reduced average and tail latency compared to 3x replicated pool. However, selecting a replica size is not as simple as it sounds. The pool replica size must be chosen based on the underlying media. The MTBF and MTTR for flash media drastically lower compared to HDD media, It is generally considered safe if you choose a 2x replicated pool for flash media and 3x replicated pools for HDD media, but your milage will vary based on the use-case you are designing your storage system for.
| RHCS 3.2. Replica 3 vs. Replica 2 . Block Size 4Kb | ||||
| Workload | IOPS Lat | Avg Lat | P95% Lat | P99% Lat |
| Rand Read | ▼ -2.25% | ▲ 2.09% | ▲ 1.68% | ▲ 3.10% |
| Rand RW(70R/30W) | ▼ -27.43% | ▲ 60.56% | ▲ 53.42% | ▲ 51.39% |
| Random Write | ▼ -29.08% | ▲ 51.45% | ▲ 52.49% | ▲ 50.96% |
Table 2 . Replica 3 vs Replica 2 . Block Size 4Kb
Graph 4. Pool Replica 2 vs Replica 3
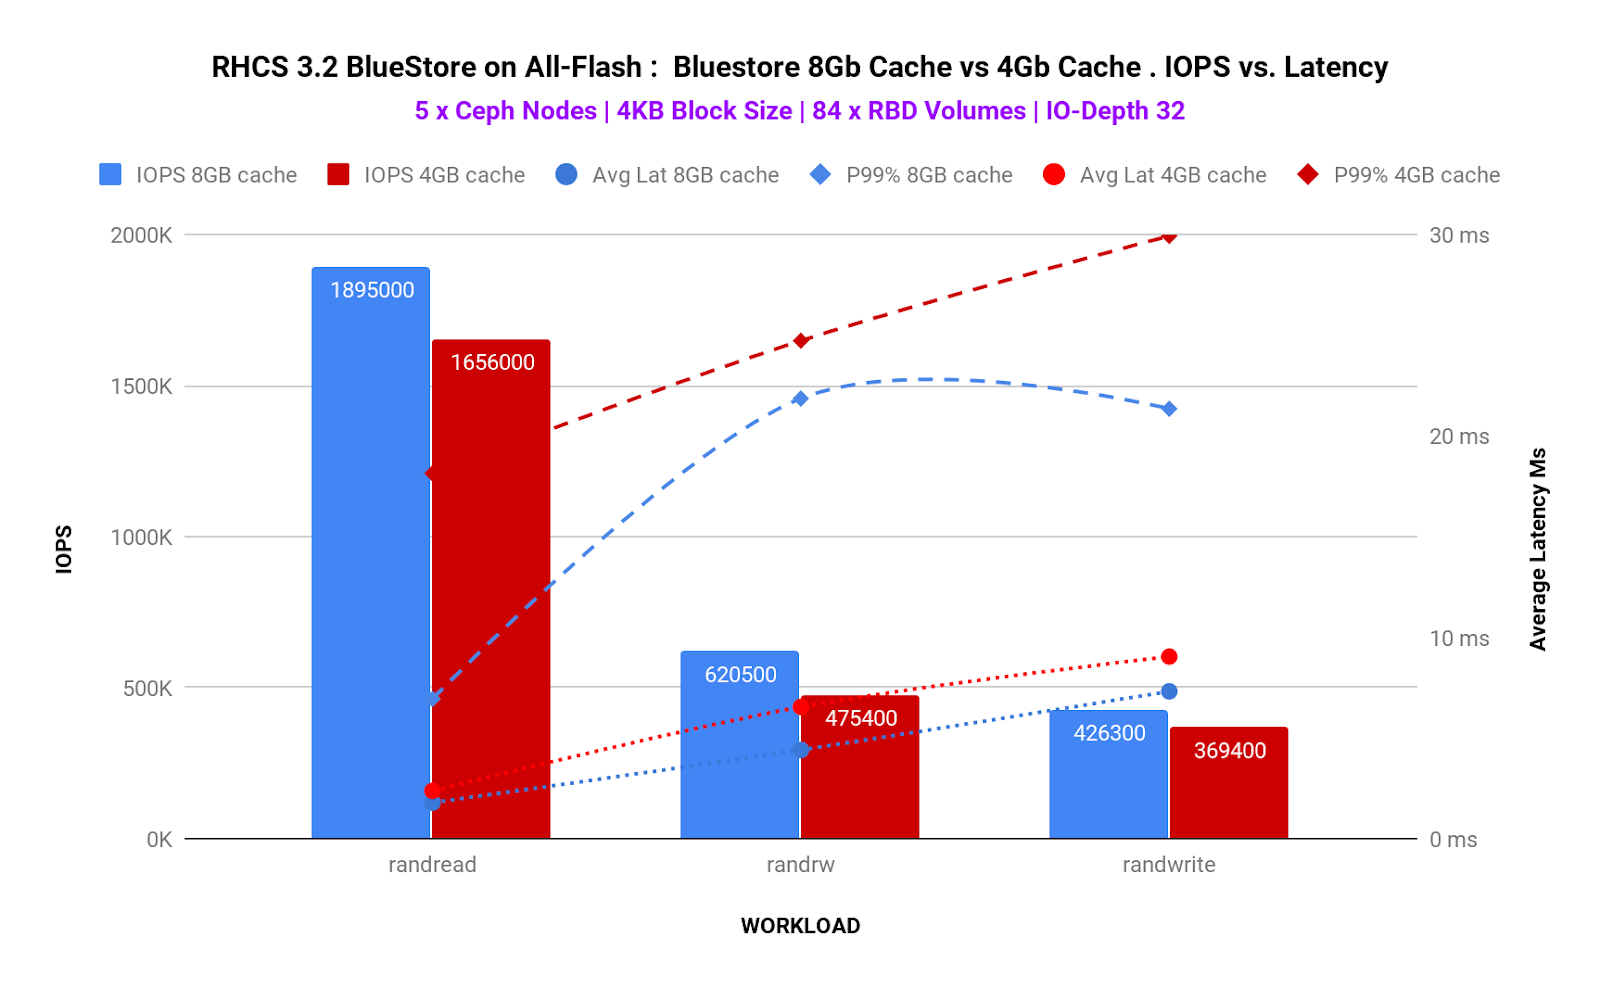
Benchmark 4: Bluestore 8GB cache vs Bluestore 4GB Cache 
Key Takeaways 
- For RBD use-cases, If the dataset fits on the Onode cache clear performance improvements could be observed.
- With 8Gb bluestore cache we observed30% higher IOPS and 32% lower average Latency for random write workloads.
Summary 
For RBD workloads on Ceph BlueStore, the size of the bluestore cache can have a material impact on performance. Onode caching in bluestore is hierarchical. If an Onode is not cached, it will be read from the DB disk, populated into the KV cache, and finally populated into the Bluestore Onode cache. As you can imagine having a direct hit in the Onode cache is much faster than reading from disk or from the KV cache.
When all Onodes in a data set fits into BlueStore's block cache, the Onodes are never read from disk and thus Onodes never have to be populated into the KV cache at all. This is the optimal scenario for RBD. On the other hand, a worst case scenario is where you end up reading Onodes from disk which populates both the rocksdb KV cache and the bluestore onode cache with fresh data and forces out older onodes, which may be read back in again from disk later.
As such, we found that by increasing BlueStore cache size to 8G, random read-write (70/30) workload performance could be increased up to 30% higher IOPS and 50% reduced tail latency.
| RHCS 3.2. Bluestore 8Gb Cache vs. 4Gb Cache . Block Size 4Kb | ||||
| Workload | IOPS | Avg Lat | P95% Lat | P99% Lat |
| Rand Read | ▲ 14.43% | ▼ -24.57% | ▼ -25.43% | ▼ -61.76% |
| Rand RW(70R/30W) | ▲ 30.52% | ▼ -32.62% | ▼ -52.12% | ▼ -11.60% |
| Random Write | ▲ 15.40% | ▼ -19.10% | ▼ -24.31% | ▼ -28.68% |
Table 3 . Bluestore 8Gb Cache vs. 4Gb Cache . Block Size 4Kb
Benchmark 5: Using Intel Optane P4800x disk as the WAL/RocksDB device 
Key Takeaways 
- Intel Optane P4800x used as BlueStore WAL and RocksDB metadata delivers up to ~10% higher IOPS, ~14% lower tail latency.
- If your workload demands higher throughput and lower tail latencies, Intel Optane P4800 is an interesting choice to host BlueStore metadata.
Summary 
With this test, we wanted to answer a simple question "Does Intel Optane P4800x, when used as BlueStore metadata device, improve the performance?"
To answer this, a similar test was executed twice. In round-1 BlueStore metadata (rocksdb and WAL) partitions were co-located with the BlueStore data partition on the same device (p4500). And round-2 included BlueStore metadata (rocksdb and WAL) were configured on Intel Optane P4800x device with BlueStore data partition on P4500
Graph-6 shows the IOPS, average latency and P99% for 8KB block tests across random read, write and read-write pattern. As highlighted in the graph, using Intel Optane P4800x helps to slightly improve IOPS and significantly better P99 tail latency in random write workloads.
Achieving predictable performance is critical for production database and as a fact database workloads are super sensitive to tail latencies. Using the P4800x Intel Optane drive during the tests we have observed minimal variations in the 99th percentile latency it’s not only that we have observed lower P99% latency but we have achieved predictable and consistent tail latency results, which is of utmost importance to database workloads.
| RHCS 3.2. Optane vs. No Optane . Block Size 8Kb | ||||
| Workload | IOPS | Avg Lat | P95% Lat | P99% Lat |
| Rand Read | ▲ 4.06% | ▼ -1.05% | ▼ -2.46% | ▼ -2.29% |
| Rand RW(70R/30W) | ▲ 9.55% | ▼ -3.83% | ▼ -4.57% | ▼ -4.01% |
| Random Write | ▲ 7.23% | ▼ -4.40% | ▼ -13.08% | ▼ -13.82% |

Graph 6. Ceph results when using Intel Optane P4800x as the WAL/RocksDB device
Up Next 
Continuing the benchmarking blog series, in the next section, we will explain the results captured during RHCS BlueStore Recovery benchmark testing, where we will take a look at how RHCS performs during different recovery scenarios(single OSD, full Node,etc).