New in Nautilus: New Dashboard Functionality
The Ceph Dashboard shipped with Ceph Mimic was the first step in replacing the original read-only dashboard with a more flexible and extensible architecture and adding management functionality derived from the openATTIC project.
One goal for the team working on the dashboard for Ceph Nautilus was to reach feature parity with openATTIC, and we’re quite happy to report that we’ve achieved and exceeded that goal!
Infact, the Dashboard in Nautilus has gained so many new features that I plan to cover them in separate blog posts: this one will go over the new functionality specific to making the dashboard more “enterprise-ready”, while another one will explain the new Ceph management features provided by the Dashboard in more detail.
New Landing page 
Probably the most notable user-visible feature that you will be presented with when logging into Ceph Dashboard is the revamped and enhanced landing page that helps you to obtain a quick overview about your cluster’s health at a glance.
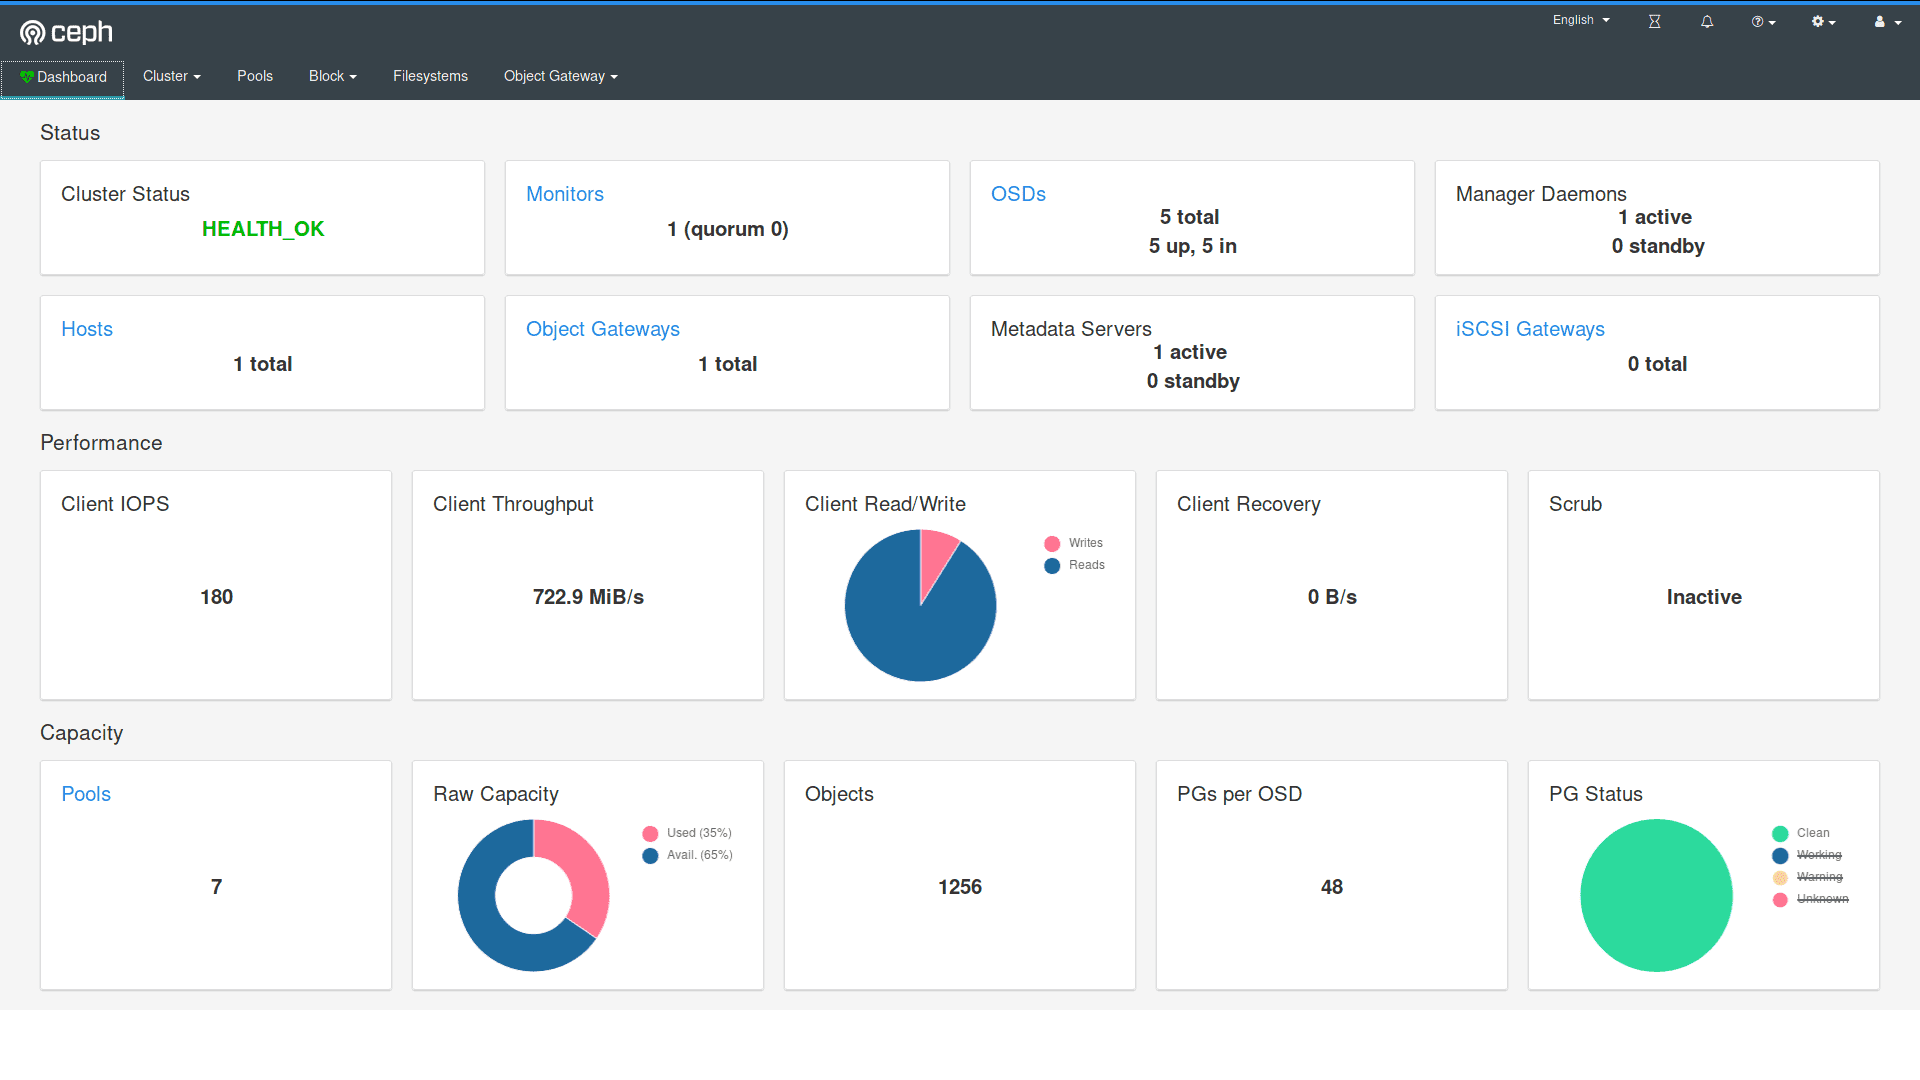
Ceph Dashboard Landing Page
Some of the metrics and information provided here include the health status of the entire cluster and key services like MONs and OSDs, a summary of key performance metrics like client IOPs and throughput as well as some capacity metrics and placement group information.
The landing page was designed to fit on a full-HD screen when running the web browser in full-screen mode, so it can be displayed on a monitor in your data center. The page refreshes every 5 seconds by default, and it’s possible to change the refresh interval.
Users and Roles 
The dashboard in Ceph Mimic added a very simple authentication mechanism, providing a single admin user account with a customizable username and password. This was necessary, as it was now possible to make changes to various aspects of the Ceph cluster (e.g. managing RBDs and RGW).
The Dashboard in Nautilus now supports multiple users: each account consists of a username, a password (stored in encrypted form using bcrypt), an optional full name, and an optional email address. User account data is stored in the MON’s configuration database, and is globally shared across all ceph-mgr instances.
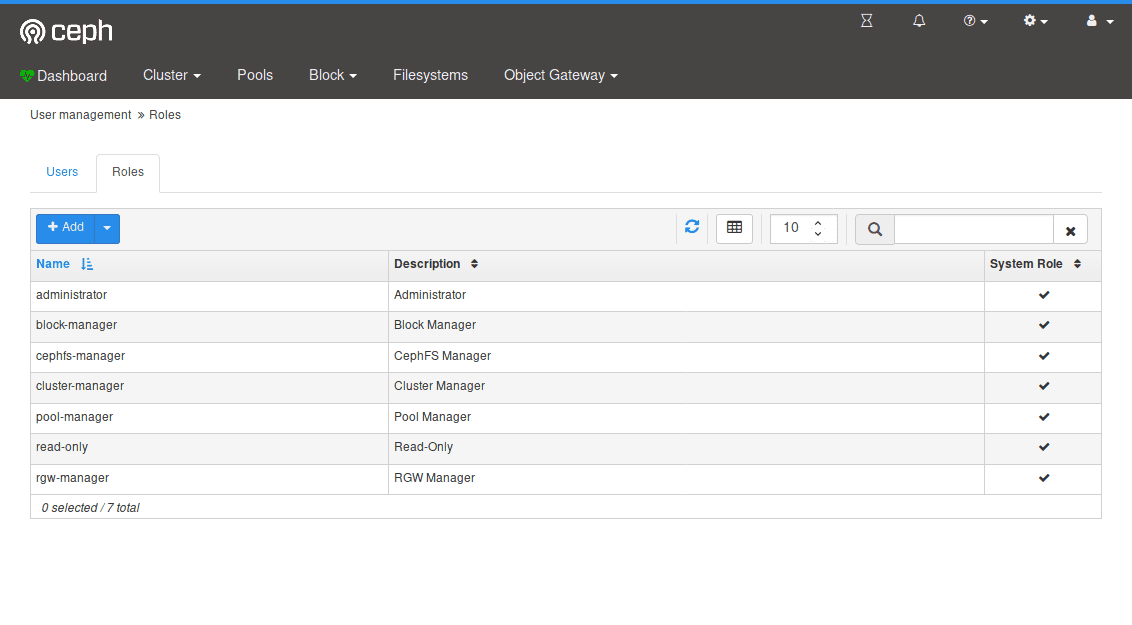
Ceph Dashboard Roles
User accounts are also associated with a set of roles that define which dashboard functionality can be accessed by the user. The roles are customizable and we provide a number of pre-defined system roles, e.g. a “readonly user” that has view-only access to all aspects, or service-specific roles like an RGW admin role. This way, you can give dashboard access to users with different levels of capabilities/privileges.
SSO (SAML 2.0) 
Another user management-related enhancement is the possiblility to offload the authentication to an external single sign-on (SSO) service that supports the SAML 2.0 protocol.
Note that you still need to create user accounts and associate them with the desired roles first; the authorization and role assignment is still performed by the Dashboard. But this enhancement makes it possible to disable access to users that should not have access to the dashboard anymore or to enforce specific password management policies.
We’ve tested the implementation against KeyCloak and Shibboleth – we’d like to hear from you if you succeeded (or failed) in integrating the dashboard with other SAML 2.0 compliant identity providers!
Auditing support 
The dashboard’s REST API is now capable of logging PUT, POST and DELETE HTTP requests to the Ceph audit log. This feature is disabled by default, but can be enabled with a simple command. This allows you to keep better track of who changed what, and when, both via the Dashboard’s web interface as well as using the REST API directly.
I18N 
The dashboard’s web interface has been translated into a variety of languages that you can choose from. This hopefully makes it easier for Ceph users in non-English speaking countries to manage and monitor Ceph using a more familiar language. We’re very grateful for the many translations we received from the community via our public translation platform (kindly provided by Transifex).
![]()
Ceph Dashboard Translations on Transifex
If you’re finding inconsistencies, missing translations or want to contribute a completely new language, please get in touch with us! We continue to improve the existing translations and add new languages as they come available.
Swagger REST API documentation 
There is an automatically generated Swagger UI page for documentation of the REST API endpoints. This makes the REST API self-documenting and makes it possible to quickly test REST API calls via the web browser, if you want to perform any management tasks via a custom script or application.
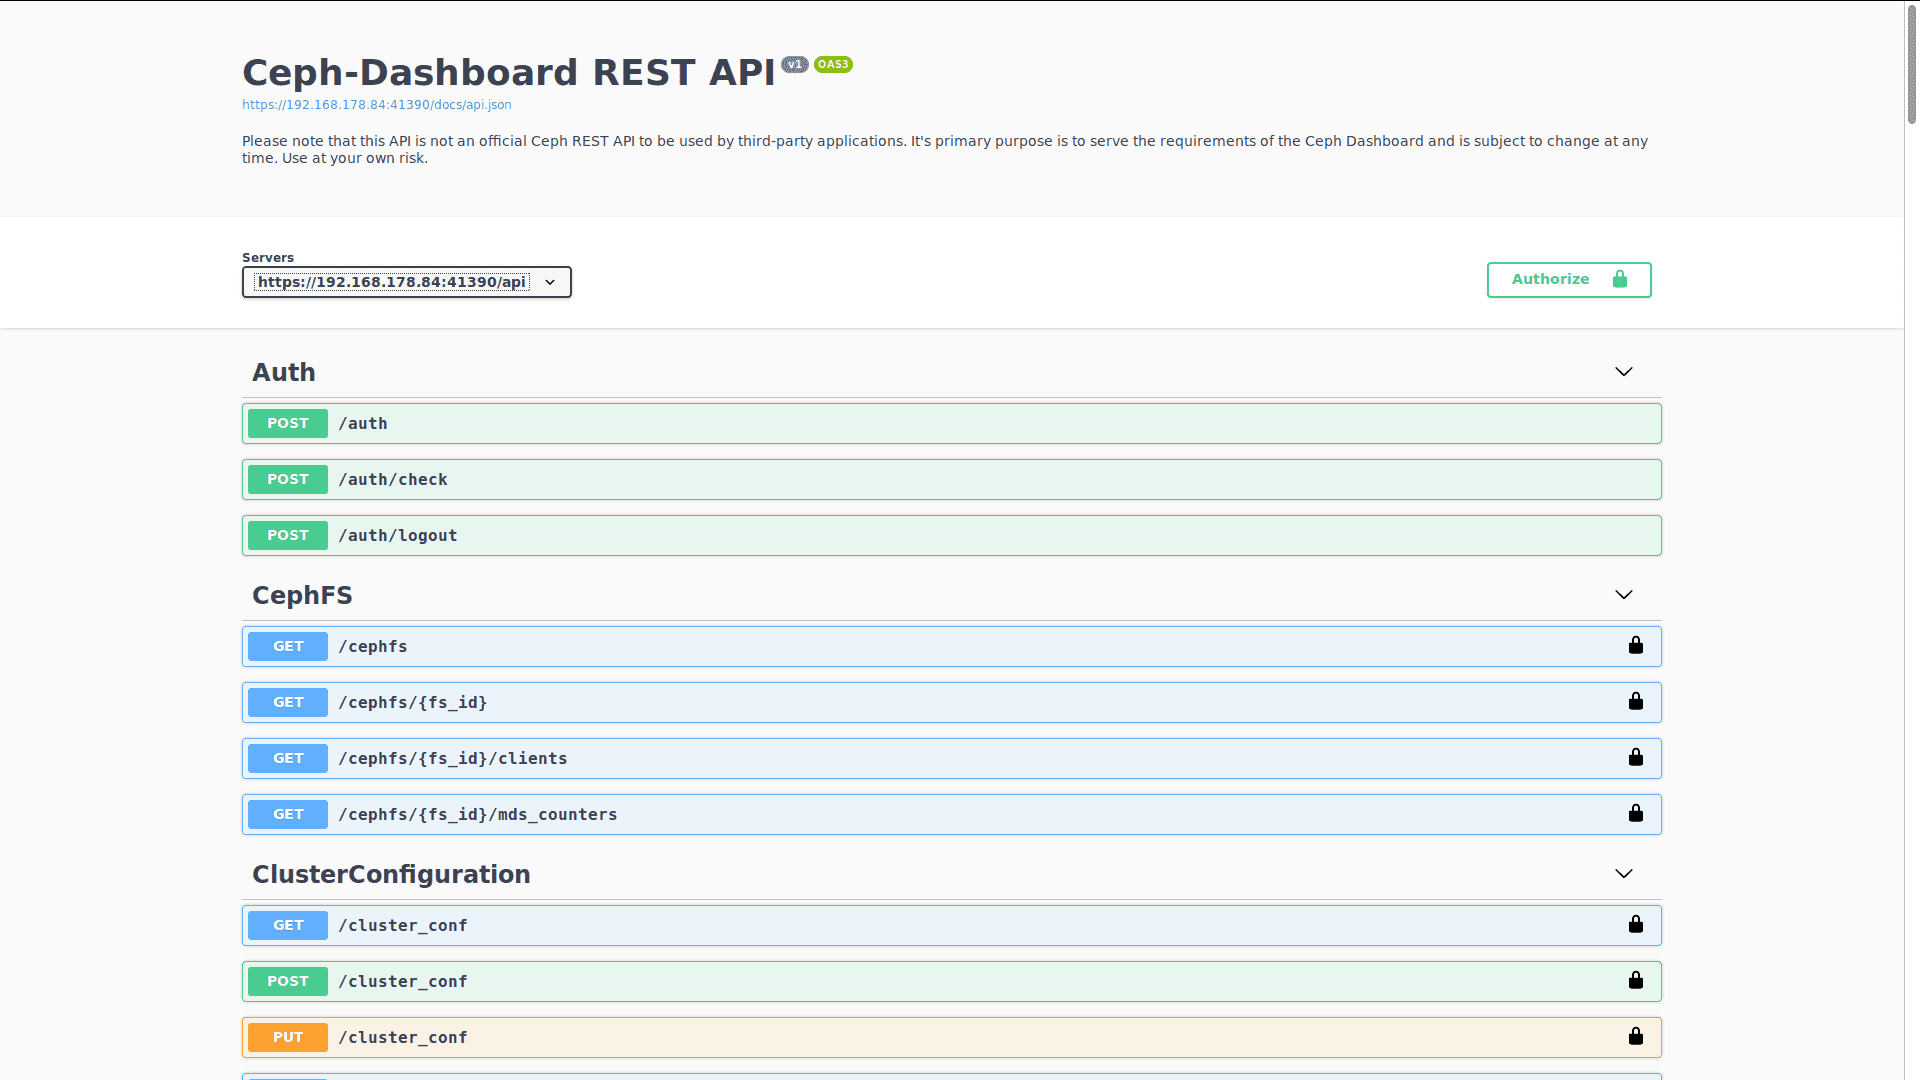
Ceph Dashboard Swagger REST API
This concludes my first “What’s new in Nautilus” blog post about the dashboard. Stay tuned for the follow-up that talks about the new Caph management and monitoring capabilities that we’ve added!